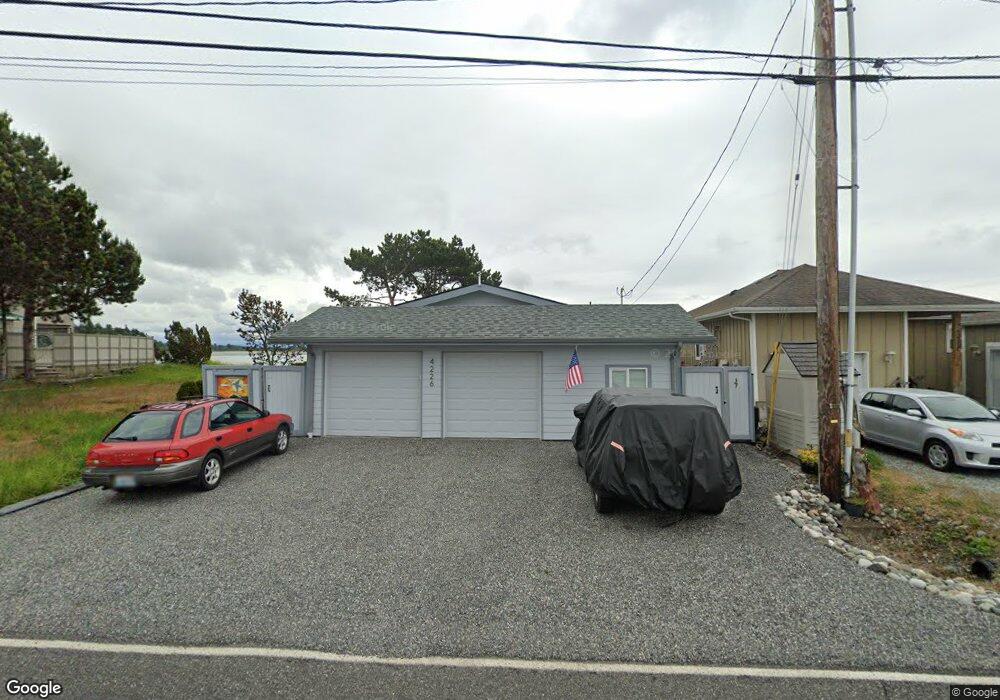
4226 Salt Spring Dr Ferndale, WA 98248
Estimated Value: $628,000 - $773,000
2
Beds
2
Baths
1,254
Sq Ft
$556/Sq Ft
Est. Value
About This Home
This home is located at 4226 Salt Spring Dr, Ferndale, WA 98248 and is currently estimated at $696,735, approximately $555 per square foot. 4226 Salt Spring Dr is a home located in Whatcom County with nearby schools including Eagleridge Elementary School, Horizon Middle School, and Ferndale High School.
Ownership History
Date
Name
Owned For
Owner Type
Purchase Details
Closed on
Dec 10, 2020
Sold by
Komar Edward and Komar Patricia
Bought by
Phillips Paul Bryant and Phillips Galyna
Current Estimated Value
Purchase Details
Closed on
Aug 25, 2009
Sold by
Thomsen David J
Bought by
Komar Edward and Komar Patricia
Purchase Details
Closed on
Sep 12, 2006
Sold by
Thomsen Sheila
Bought by
Thomsen David J
Home Financials for this Owner
Home Financials are based on the most recent Mortgage that was taken out on this home.
Original Mortgage
$308,000
Interest Rate
6.56%
Mortgage Type
Purchase Money Mortgage
Purchase Details
Closed on
Sep 8, 2006
Sold by
Jarrett Candace
Bought by
Thomsen David J
Home Financials for this Owner
Home Financials are based on the most recent Mortgage that was taken out on this home.
Original Mortgage
$308,000
Interest Rate
6.56%
Mortgage Type
Purchase Money Mortgage
Purchase Details
Closed on
Dec 31, 2002
Sold by
Jarrett Mark F and Jarrett Dorothy G
Bought by
Jarrett Mark F and Jarrett Dorothy G
Create a Home Valuation Report for This Property
The Home Valuation Report is an in-depth analysis detailing your home's value as well as a comparison with similar homes in the area
Home Values in the Area
Average Home Value in this Area
Purchase History
| Date | Buyer | Sale Price | Title Company |
|---|---|---|---|
| Phillips Paul Bryant | $419,900 | Whatcom Land Title | |
| Phellips Paul Bryant | $419,900 | Whatcom Land Title | |
| Komar Edward | $240,280 | Stewart Title Company | |
| Thomsen David J | -- | Stewart Title Company | |
| Thomsen David J | $385,280 | Stewart Title Company | |
| Jarrett Mark F | -- | -- |
Source: Public Records
Mortgage History
| Date | Status | Borrower | Loan Amount |
|---|---|---|---|
| Previous Owner | Thomsen David J | $308,000 |
Source: Public Records
Tax History Compared to Growth
Tax History
| Year | Tax Paid | Tax Assessment Tax Assessment Total Assessment is a certain percentage of the fair market value that is determined by local assessors to be the total taxable value of land and additions on the property. | Land | Improvement |
|---|---|---|---|---|
| 2024 | $4,551 | $620,218 | $362,884 | $257,334 |
| 2023 | $4,551 | $647,470 | $378,825 | $268,645 |
| 2022 | $3,742 | $537,309 | $314,366 | $222,943 |
| 2021 | $3,647 | $417,117 | $278,200 | $138,917 |
| 2020 | $3,879 | $367,348 | $219,482 | $147,866 |
| 2019 | $2,942 | $353,701 | $211,328 | $142,373 |
| 2018 | $3,652 | $303,403 | $181,276 | $122,127 |
| 2017 | $3,388 | $288,647 | $172,058 | $116,589 |
| 2016 | $3,317 | $283,077 | $168,730 | $114,347 |
| 2015 | $2,946 | $278,505 | $166,400 | $112,105 |
| 2014 | -- | $249,077 | $149,760 | $99,317 |
| 2013 | -- | $249,077 | $149,760 | $99,317 |
Source: Public Records
Map
Nearby Homes
- 4448 Saltspring Dr
- 4273 Saltspring Dr
- 4149 Saltspring Dr
- 4144 Saltspring Dr
- 4311 Sucia Dr
- 4383 Sucia Dr
- 4139 Patos Dr
- 4126 Matia Dr
- 4418 Sucia Dr
- 4421 Sucia Dr
- 4440 Sucia Dr
- 4489 Sucia Dr
- 3913 Saltspring Dr
- 3909 Saltspring Dr
- 3905 Saltspring Dr
- 3910 Saltspring Dr
- 3906 Saltspring Dr
- 3895 Saltspring Dr
- 3902 Saltspring Dr
- 3758 Sinclair Dr
- 4226 Saltspring Dr
- 4222 Saltspring Dr
- 4238 Saltspring Dr
- 4238 Salt Spring Dr
- 4218 Salt Spring Dr
- 4214 Saltspring Dr
- 4225 Salt Spring Dr
- 4242 Saltspring Dr
- 4239 Saltspring Dr
- 4225 Saltspring Dr
- 50 Saltspring Dr
- 3 Saltspring Dr
- 4232 Saltspring Dr
- 0 XXXX Saltspring Dr
- 52 4 Saltspring Dr
- 0 Lot 21 Saltspring Dr
- 0 XXX Saltspring Dr
- 0 Saltspring Dr