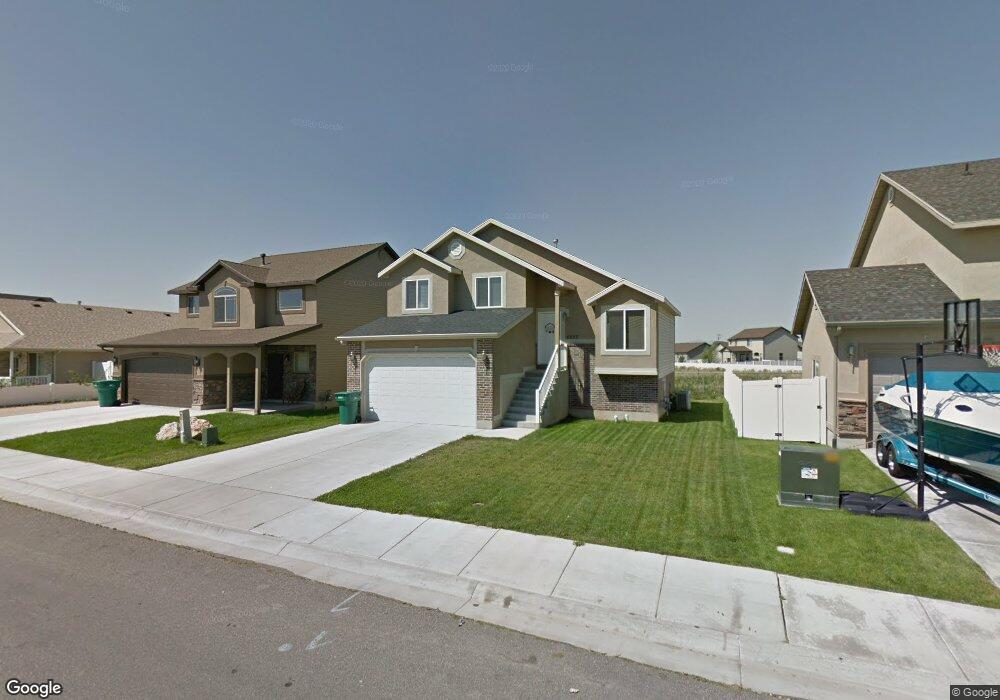
4227 S 3450 W West Haven, UT 84401
Estimated Value: $439,709 - $464,000
3
Beds
2
Baths
1,758
Sq Ft
$255/Sq Ft
Est. Value
About This Home
This home is located at 4227 S 3450 W, West Haven, UT 84401 and is currently estimated at $448,427, approximately $255 per square foot. 4227 S 3450 W is a home located in Weber County with nearby schools including West Haven School, Sand Ridge Junior High School, and Roy High School.
Ownership History
Date
Name
Owned For
Owner Type
Purchase Details
Closed on
Nov 13, 2014
Sold by
Hopkins Paul J and Hopkins Velma I
Bought by
Amer Homes 4 Rent Properties Nine Llc
Current Estimated Value
Purchase Details
Closed on
Sep 20, 2007
Sold by
Welbuilt Enterprises Inc
Bought by
Hopkins Paul J
Home Financials for this Owner
Home Financials are based on the most recent Mortgage that was taken out on this home.
Original Mortgage
$155,900
Interest Rate
6.4%
Mortgage Type
Purchase Money Mortgage
Purchase Details
Closed on
Feb 7, 2007
Sold by
Karras Allan
Bought by
Lakeview Farms 1 Llc
Home Financials for this Owner
Home Financials are based on the most recent Mortgage that was taken out on this home.
Original Mortgage
$154,800
Interest Rate
6.19%
Mortgage Type
Construction
Purchase Details
Closed on
Mar 24, 2006
Sold by
Northern Developers Llc
Bought by
Karras Allan
Create a Home Valuation Report for This Property
The Home Valuation Report is an in-depth analysis detailing your home's value as well as a comparison with similar homes in the area
Home Values in the Area
Average Home Value in this Area
Purchase History
| Date | Buyer | Sale Price | Title Company |
|---|---|---|---|
| Amer Homes 4 Rent Properties Nine Llc | -- | Inwest Title Services | |
| Hopkins Paul J | -- | Mountain View Title | |
| Lakeview Farms 1 Llc | -- | Mountain View Title Ogden | |
| Welbuilt Enterprises Inc | -- | Mountain View Title Ogden | |
| Lakeview Farms 1 Llc | -- | Mountain View Title Ogden | |
| Karras Allan | -- | Security Title |
Source: Public Records
Mortgage History
| Date | Status | Borrower | Loan Amount |
|---|---|---|---|
| Previous Owner | Hopkins Paul J | $155,900 | |
| Previous Owner | Lakeview Farms 1 Llc | $154,800 |
Source: Public Records
Tax History Compared to Growth
Tax History
| Year | Tax Paid | Tax Assessment Tax Assessment Total Assessment is a certain percentage of the fair market value that is determined by local assessors to be the total taxable value of land and additions on the property. | Land | Improvement |
|---|---|---|---|---|
| 2025 | $2,678 | $430,614 | $118,433 | $312,181 |
| 2024 | $2,585 | $423,000 | $118,433 | $304,567 |
| 2023 | $2,564 | $417,000 | $118,678 | $298,322 |
| 2022 | $2,430 | $406,000 | $113,813 | $292,187 |
| 2021 | $2,061 | $318,000 | $65,066 | $252,934 |
| 2020 | $1,913 | $271,000 | $50,856 | $220,144 |
| 2019 | $1,817 | $242,000 | $47,551 | $194,449 |
| 2018 | $1,693 | $214,000 | $42,499 | $171,501 |
| 2017 | $1,594 | $194,000 | $45,311 | $148,689 |
| 2016 | $1,432 | $92,953 | $22,785 | $70,168 |
| 2015 | $1,361 | $86,657 | $19,830 | $66,827 |
| 2014 | $1,275 | $78,450 | $19,830 | $58,620 |
Source: Public Records
Map
Nearby Homes
- 4317 S 3350 W
- 4351 W 4000 S
- 3960 S 3375 W
- 3385 W 3950 S
- 4440 Stone Creek Rd Unit 2E
- 4124 S 3560 W
- 3554 W 4100 S Unit 63
- 3084 W 4375 S
- 3229 W 3855 S
- 3942 S 3450 W
- 3959 S 3485 W
- 3835 S 3250 W
- 3829 S 3250 W
- 4491 Haven Creek Rd Unit A
- 3367 W 3785 S
- 2979 W 4275 S
- Buchanan | Lot 4025 Plan at Salt Point - Legacy
- Buchanan Model Home | Lot 0015 Plan at Salt Point - Legacy
- 4510 Stone Creek Rd Unit F
- 3329 W 3745 S
- 4227 S 3450 W Unit 307
- 4223 S 3450 W
- 4229 S 3450 W
- 4229 S 3450 W Unit 306
- 4217 S 3450 W
- 4217 S 3450 W Unit 309
- 4217 S 3450 W Unit 1
- 4233 S 3450 W
- 3441 W 4225 S Unit 358
- 3441 W 4225 S
- 3456 W 4250 S
- 4235 S 3450 W
- 4235 S 3450 W Unit 304
- 4209 S 3450 W
- 3428 W 4225 S Unit 359
- 3428 W 4225 S
- 3415 W 4225 S
- 3415 W 4225 S Unit 357
- 3415 W 4225 S Unit 39
- 3422 W 4250 S