4228 Sandy Branch Dr Unit 1 Buford, GA 30519
Estimated Value: $552,000 - $592,000
5
Beds
3
Baths
3,287
Sq Ft
$177/Sq Ft
Est. Value
About This Home
This home is located at 4228 Sandy Branch Dr Unit 1, Buford, GA 30519 and is currently estimated at $581,021, approximately $176 per square foot. 4228 Sandy Branch Dr Unit 1 is a home located in Gwinnett County with nearby schools including Harmony Elementary School and Glenn C. Jones Middle School.
Ownership History
Date
Name
Owned For
Owner Type
Purchase Details
Closed on
Nov 1, 2002
Sold by
Garen Homes Inc
Bought by
Scott Joseph M
Current Estimated Value
Home Financials for this Owner
Home Financials are based on the most recent Mortgage that was taken out on this home.
Original Mortgage
$245,385
Outstanding Balance
$129,189
Interest Rate
9.62%
Mortgage Type
New Conventional
Estimated Equity
$451,832
Create a Home Valuation Report for This Property
The Home Valuation Report is an in-depth analysis detailing your home's value as well as a comparison with similar homes in the area
Home Values in the Area
Average Home Value in this Area
Purchase History
| Date | Buyer | Sale Price | Title Company |
|---|---|---|---|
| Scott Joseph M | $272,700 | -- |
Source: Public Records
Mortgage History
| Date | Status | Borrower | Loan Amount |
|---|---|---|---|
| Open | Scott Joseph M | $245,385 |
Source: Public Records
Tax History Compared to Growth
Tax History
| Year | Tax Paid | Tax Assessment Tax Assessment Total Assessment is a certain percentage of the fair market value that is determined by local assessors to be the total taxable value of land and additions on the property. | Land | Improvement |
|---|---|---|---|---|
| 2025 | $6,696 | $245,520 | $54,400 | $191,120 |
| 2024 | $6,432 | $224,840 | $41,600 | $183,240 |
| 2023 | $6,432 | $224,840 | $41,600 | $183,240 |
| 2022 | $5,666 | $189,080 | $37,200 | $151,880 |
| 2021 | $4,918 | $149,040 | $29,560 | $119,480 |
| 2020 | $4,657 | $135,320 | $25,120 | $110,200 |
| 2019 | $4,513 | $135,320 | $25,120 | $110,200 |
| 2018 | $4,382 | $128,880 | $25,120 | $103,760 |
| 2016 | $3,966 | $108,880 | $20,000 | $88,880 |
| 2015 | $4,008 | $108,880 | $20,000 | $88,880 |
| 2014 | $4,030 | $108,880 | $20,000 | $88,880 |
Source: Public Records
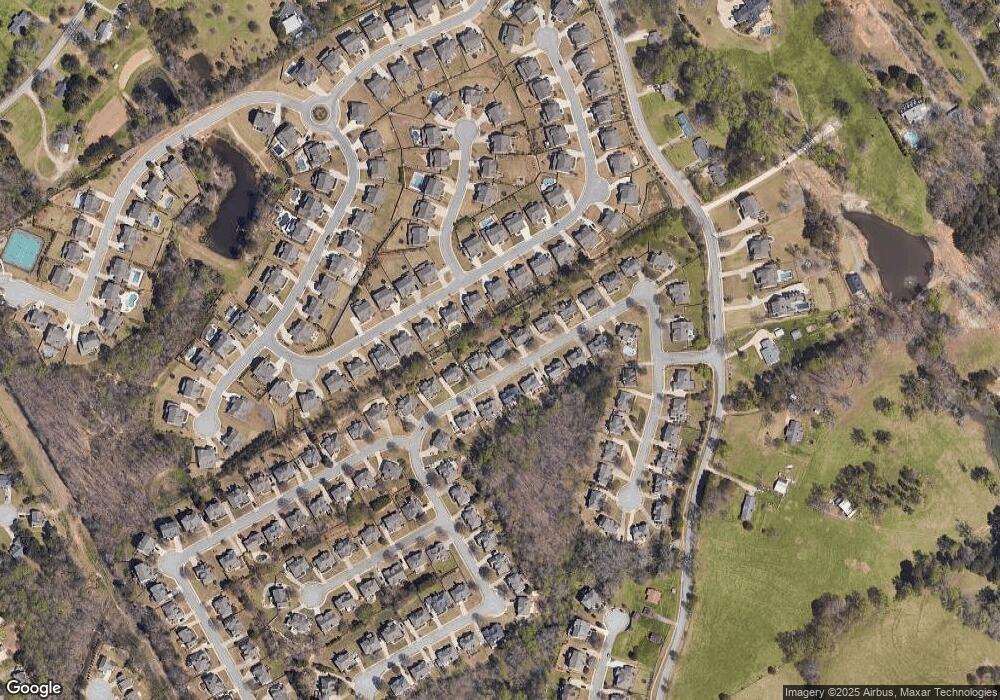
Map
Nearby Homes
- 3340 Ivey Ridge Rd NE
- 4304 Grey Park Dr
- 3236 Copper Creek Ln NE
- 4481 Bogan Gates Trail
- 3271 Meadow Lily Ct
- 3445 Lake Seminole Dr
- 4637 Landing Water Path
- 4679 Silver Meadow Dr
- 3016 Sea Aster Way
- 3026 Sea Aster Way
- 3345 Stoneleigh Run Dr
- 4375 Easter Lily Ave
- 3550 N Bogan Rd
- 2843 N Bogan Rd
- 3032 Seneca Farm Ln
- 2930 Blake Towers Ln
- 2910 Blake Towers Ln
- 3745 Lake Seminole Dr
- 4238 Sandy Branch Dr
- 4218 Sandy Branch Dr NE
- 4238 Sandy Branch Dr NE
- 3399 Lily Magnolia Ct
- 3389 Lily Magnolia Ct
- 3409 Lily Magnolia Ct
- 4248 Sandy Branch Dr
- 4208 Sandy Branch Dr
- 4217 Sandy Branch Dr
- 4227 Sandy Branch Dr Unit 1
- 4227 Sandy Branch Dr
- 3379 Lily Magnolia Ct
- 3419 Lily Magnolia Ct
- 4207 Sandy Branch Dr
- 4237 Sandy Branch Dr
- 4258 Sandy Branch Dr
- 4198 Sandy Branch Dr Unit 1
- 3369 Lily Magnolia Ct
- 4247 Sandy Branch Dr
- 4197 Sandy Branch Dr Unit 1