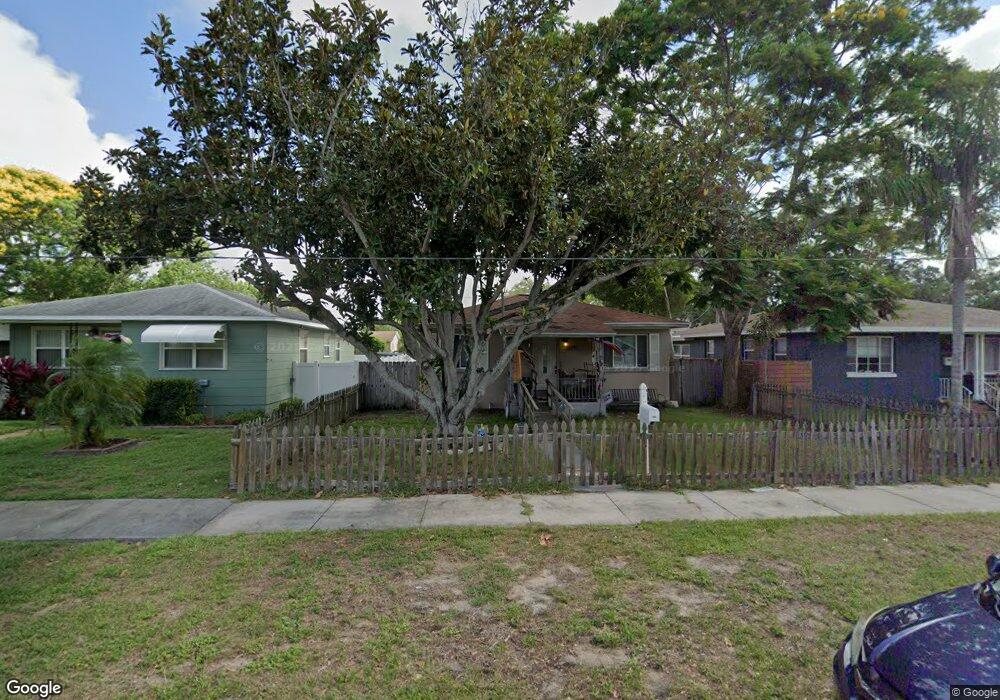
4229 10th Ave N Saint Petersburg, FL 33713
Central Oak Park NeighborhoodEstimated Value: $321,000 - $410,000
3
Beds
2
Baths
1,160
Sq Ft
$315/Sq Ft
Est. Value
About This Home
This home is located at 4229 10th Ave N, Saint Petersburg, FL 33713 and is currently estimated at $365,667, approximately $315 per square foot. 4229 10th Ave N is a home located in Pinellas County with nearby schools including Mount Vernon Elementary School, Tyrone Middle School, and St. Petersburg High School.
Ownership History
Date
Name
Owned For
Owner Type
Purchase Details
Closed on
Aug 11, 2009
Sold by
Santos Christy L and Santos Scott
Bought by
Cartelli Vincent and Cartelli Cynthia Check
Current Estimated Value
Home Financials for this Owner
Home Financials are based on the most recent Mortgage that was taken out on this home.
Original Mortgage
$98,188
Outstanding Balance
$63,692
Interest Rate
5.11%
Mortgage Type
FHA
Estimated Equity
$301,975
Purchase Details
Closed on
Jul 8, 2005
Sold by
Costello Frank J and Costello Kim E
Bought by
Swift Development Of Tampa Bay Llc
Purchase Details
Closed on
May 7, 1997
Sold by
Wilbur Jeffrey A and Wilbur Thelma J
Bought by
Costello Frank J and Costello Kim E
Home Financials for this Owner
Home Financials are based on the most recent Mortgage that was taken out on this home.
Original Mortgage
$36,000
Interest Rate
7.98%
Purchase Details
Closed on
Mar 13, 1996
Sold by
Wilbur Lanette Miller
Bought by
Wilbur Jeffrey A
Create a Home Valuation Report for This Property
The Home Valuation Report is an in-depth analysis detailing your home's value as well as a comparison with similar homes in the area
Home Values in the Area
Average Home Value in this Area
Purchase History
| Date | Buyer | Sale Price | Title Company |
|---|---|---|---|
| Cartelli Vincent | $100,000 | Title Insurors Of Florida | |
| Swift Development Of Tampa Bay Llc | $125,000 | Somers Title Company | |
| Costello Frank J | $38,300 | -- | |
| Wilbur Jeffrey A | -- | -- | |
| Wilbur Jeffrey A | -- | -- |
Source: Public Records
Mortgage History
| Date | Status | Borrower | Loan Amount |
|---|---|---|---|
| Open | Cartelli Vincent | $98,188 | |
| Previous Owner | Wilbur Jeffrey A | $36,000 |
Source: Public Records
Tax History Compared to Growth
Tax History
| Year | Tax Paid | Tax Assessment Tax Assessment Total Assessment is a certain percentage of the fair market value that is determined by local assessors to be the total taxable value of land and additions on the property. | Land | Improvement |
|---|---|---|---|---|
| 2024 | $891 | $95,139 | -- | -- |
| 2023 | $891 | $92,368 | $0 | $0 |
| 2022 | $934 | $89,678 | $0 | $0 |
| 2021 | $927 | $87,066 | $0 | $0 |
| 2020 | $917 | $85,864 | $0 | $0 |
| 2019 | $885 | $83,934 | $0 | $0 |
| 2018 | $860 | $82,369 | $0 | $0 |
| 2017 | $840 | $80,675 | $0 | $0 |
| 2016 | $819 | $79,016 | $0 | $0 |
| 2015 | $832 | $78,467 | $0 | $0 |
| 2014 | $822 | $77,844 | $0 | $0 |
Source: Public Records
Map
Nearby Homes
- 4347 9th Ave N
- 4320 8th Ave N
- 4062 9th Ave N
- 4015 10th Ave N
- 1235 45th St N
- 4300 14th Ave N
- 4242 7th Ave N
- 3941 9th Ave N
- 695 41st St N
- 4595 9th Ave N
- 4010 7th Ave N
- 4301 15th Ave N
- 3910 14th Ave N
- 440 42nd St N
- 1601 43rd St N Unit 224
- 1601 43rd St N Unit 111
- 4744 11th Ave N
- 4688 8th Ave N
- 4594 16th Ave N
- 4127 4th Ave N
- 4221 10th Ave N
- 4237 10th Ave N
- 4201 10th Ave N
- 4224 11th Ave N
- 1015 43rd St N
- 1001 43rd St N
- 4200 11th Ave N
- 4230 10th Ave N
- 4236 10th Ave N
- 4252 11th Ave N
- 4212 10th Ave N
- 4240 10th Ave N
- 4250 10th Ave N
- 4280 11th Ave N
- 4163 10th Ave N
- 4262 10th Ave N
- 1065 42nd St N
- 4153 10th Ave N
- 4225 9th Ave N
- 4217 9th Ave N