Estimated Value: $544,000 - $764,000
3
Beds
2
Baths
2,449
Sq Ft
$271/Sq Ft
Est. Value
About This Home
This home is located at 4229 E 256 N, Rigby, ID 83442 and is currently estimated at $663,998, approximately $271 per square foot. 4229 E 256 N is a home with nearby schools including South Fork Elementary School, Rigby Middle School, and Rigby High School.
Ownership History
Date
Name
Owned For
Owner Type
Purchase Details
Closed on
Jun 16, 2021
Sold by
Blacker Thomas E and Blacker Sandra L
Bought by
Adams Andrew and Adams Christine
Current Estimated Value
Home Financials for this Owner
Home Financials are based on the most recent Mortgage that was taken out on this home.
Original Mortgage
$522,500
Outstanding Balance
$469,956
Interest Rate
2.9%
Mortgage Type
New Conventional
Estimated Equity
$194,042
Purchase Details
Closed on
May 29, 2013
Sold by
Sunrise Estates Inc
Bought by
Blacker Thomas E and Blacker Sandra L
Create a Home Valuation Report for This Property
The Home Valuation Report is an in-depth analysis detailing your home's value as well as a comparison with similar homes in the area
Home Values in the Area
Average Home Value in this Area
Purchase History
| Date | Buyer | Sale Price | Title Company |
|---|---|---|---|
| Adams Andrew | -- | Alliance Ttl Rexburg Office | |
| Blacker Thomas E | -- | First American Title |
Source: Public Records
Mortgage History
| Date | Status | Borrower | Loan Amount |
|---|---|---|---|
| Open | Adams Andrew | $522,500 |
Source: Public Records
Tax History
| Year | Tax Paid | Tax Assessment Tax Assessment Total Assessment is a certain percentage of the fair market value that is determined by local assessors to be the total taxable value of land and additions on the property. | Land | Improvement |
|---|---|---|---|---|
| 2025 | $1,359 | $621,581 | $0 | $0 |
| 2024 | $1,359 | $618,449 | $0 | $0 |
| 2023 | $2,128 | $645,216 | $0 | $0 |
| 2022 | $3,183 | $579,592 | $0 | $0 |
| 2021 | $2,735 | $417,501 | $0 | $0 |
| 2020 | $2,212 | $385,749 | $0 | $0 |
| 2019 | $2,431 | $339,340 | $0 | $0 |
| 2018 | $2,211 | $304,930 | $0 | $0 |
| 2017 | $2,121 | $289,335 | $0 | $0 |
| 2016 | $1,997 | $175,000 | $0 | $0 |
| 2015 | $1,785 | $149,752 | $0 | $0 |
| 2014 | $316 | $28,000 | $0 | $0 |
| 2013 | -- | $474 | $0 | $0 |
Source: Public Records
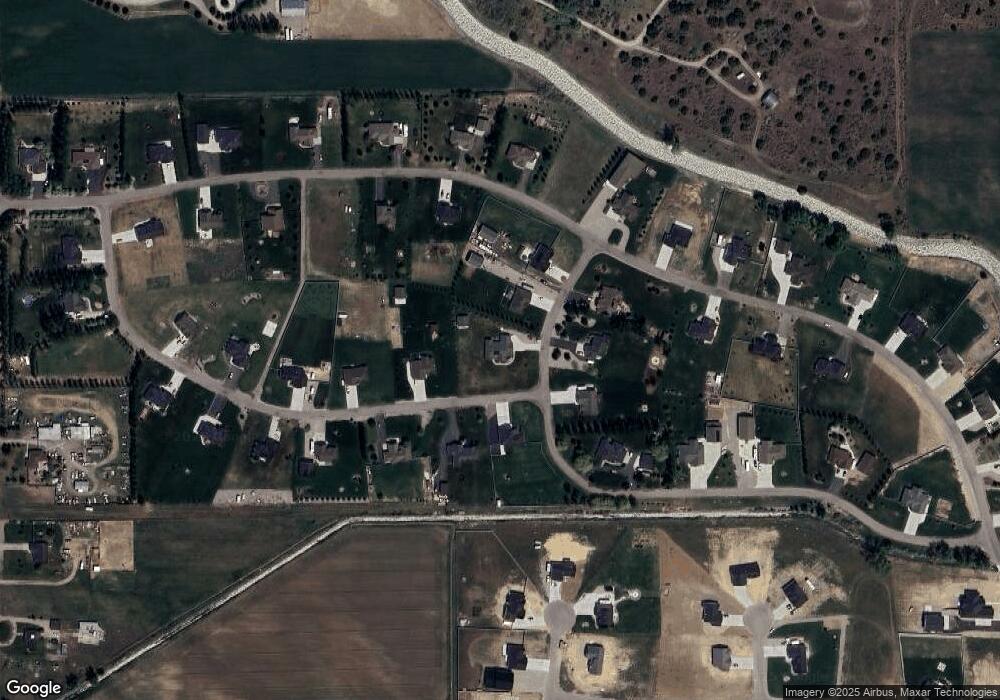
Map
Nearby Homes
- TBD N 4200 E
- 323 N 4200 E
- TBD N 4300 E
- TBD N 4300 E Unit 2
- 231 N 4135 E
- TBD N 4145 E
- 4330 E 240 N
- 4143 E 206 N
- 4136 E 206 N
- TBD E 218 N
- 209 N 4117 E
- 279 N 4100 E
- 1240 Jaylee Dr Unit 3
- 1154 Lilah St
- 1154 Lilah St Unit 2
- 1147 Lilah St Unit 4
- 1147 Lilah St Unit 2
- 1147 Lilah St Unit 3
- 1133 Lilah St Unit 1
- 1133 Lilah St Unit 4
- 261 N 4232 E
- 4225 E 256 N
- 4230 E 256 N
- 263 N 4232 E
- 258 N 4232 E
- 4228 E 256 N
- 4221 E 256 N
- 262 N 4232 E
- 4224 E Blackstone Dr
- 4224 E 256 N
- 4233 E 250 N
- 4231 E Blackstone Dr
- 4218 E 256 N
- 4238 E Blackstone Dr
- 4217 E 256 N
- 4235 E Blackstone Dr
- 156 N 4046 E
- 4223 E Blackstone Dr
- 4237 E 250 N
- TBD Blackstone Dr
Your Personal Tour Guide
Ask me questions while you tour the home.