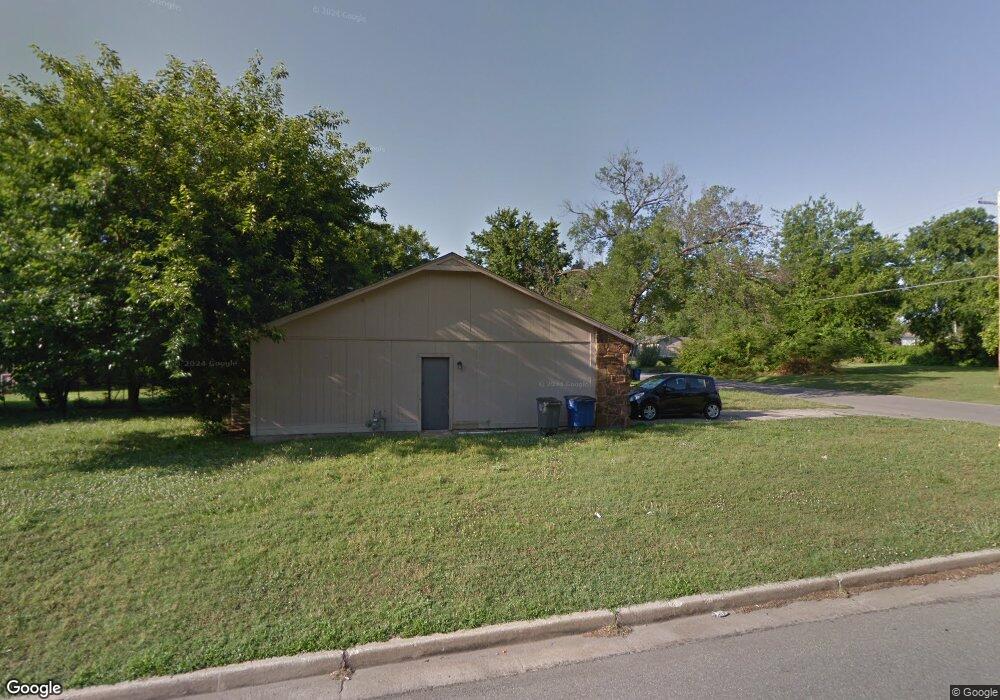
4229 S 35th Ave W Tulsa, OK 74107
Red Fork NeighborhoodEstimated Value: $121,000 - $141,000
2
Beds
1
Bath
942
Sq Ft
$140/Sq Ft
Est. Value
About This Home
This home is located at 4229 S 35th Ave W, Tulsa, OK 74107 and is currently estimated at $131,437, approximately $139 per square foot. 4229 S 35th Ave W is a home located in Tulsa County with nearby schools including Clinton West Elementary School, Daniel Webster High School, and St Catherine School.
Ownership History
Date
Name
Owned For
Owner Type
Purchase Details
Closed on
Mar 13, 2024
Sold by
Trenkle Victoria A
Bought by
Prospority Trust and Trenkle
Current Estimated Value
Purchase Details
Closed on
Mar 8, 2024
Sold by
Trenkle Victoria A
Bought by
Prospority Trust and Trenkle
Purchase Details
Closed on
May 11, 2023
Sold by
Midfirst Bank
Bought by
Trenkle Victoria and Trenkle Charles
Purchase Details
Closed on
Feb 22, 2023
Sold by
Sheriff Of Tulsa County
Bought by
Midfirst Bank
Purchase Details
Closed on
Jun 27, 2017
Sold by
Davies James Edward
Bought by
Davies Sarah Lee
Purchase Details
Closed on
Apr 20, 2007
Sold by
Trevino Delia
Bought by
Davies Sarah and Davies James
Home Financials for this Owner
Home Financials are based on the most recent Mortgage that was taken out on this home.
Original Mortgage
$75,810
Interest Rate
6.17%
Mortgage Type
FHA
Purchase Details
Closed on
Aug 1, 1992
Create a Home Valuation Report for This Property
The Home Valuation Report is an in-depth analysis detailing your home's value as well as a comparison with similar homes in the area
Home Values in the Area
Average Home Value in this Area
Purchase History
| Date | Buyer | Sale Price | Title Company |
|---|---|---|---|
| Prospority Trust | -- | None Listed On Document | |
| Prospority Trust | -- | None Listed On Document | |
| Prospority Trust | -- | None Listed On Document | |
| Prospority Trust | -- | None Listed On Document | |
| Trenkle Victoria | $50,000 | Singlesource Property Solution | |
| Trenkle Victoria | $50,000 | Singlesource Property Solution | |
| Midfirst Bank | $72,328 | -- | |
| Midfirst Bank | $72,328 | -- | |
| Davies Sarah Lee | -- | None Available | |
| Davies Sarah Lee | -- | None Available | |
| Davies Sarah | $77,000 | Colonial Title Inc | |
| Davies Sarah | $77,000 | Colonial Title Inc | |
| -- | $30,000 | -- | |
| -- | $30,000 | -- |
Source: Public Records
Mortgage History
| Date | Status | Borrower | Loan Amount |
|---|---|---|---|
| Previous Owner | Davies Sarah | $75,810 |
Source: Public Records
Tax History Compared to Growth
Tax History
| Year | Tax Paid | Tax Assessment Tax Assessment Total Assessment is a certain percentage of the fair market value that is determined by local assessors to be the total taxable value of land and additions on the property. | Land | Improvement |
|---|---|---|---|---|
| 2024 | $1,185 | $10,435 | $1,651 | $8,784 |
| 2023 | $1,185 | $9,338 | $1,477 | $7,861 |
| 2022 | $1,186 | $8,894 | $1,548 | $7,346 |
| 2021 | $1,119 | $8,470 | $1,474 | $6,996 |
| 2020 | $1,103 | $8,470 | $1,474 | $6,996 |
| 2019 | $1,161 | $8,470 | $1,474 | $6,996 |
| 2018 | $1,163 | $8,470 | $1,474 | $6,996 |
| 2017 | $1,161 | $8,470 | $1,474 | $6,996 |
| 2016 | $1,137 | $8,470 | $1,474 | $6,996 |
| 2015 | $1,139 | $8,470 | $1,474 | $6,996 |
| 2014 | $1,128 | $8,470 | $1,474 | $6,996 |
Source: Public Records
Map
Nearby Homes
- 3704 W 42nd St
- 4142 S 37th West Ave
- 3743 W 45th St
- 4136 S 39th West Ave
- 3768 W 45th St
- 4015 W 43rd St
- 4145 S 41st West Ave
- 6001 W 41st St S
- 4245 S 28th West Ave
- 4727 S 33rd West Ave
- 4532 S 28th West Ave
- 4307 W 43rd St
- 4839 S 34th West Ave
- 4216 S 25th West Ave
- 4622 S 26th West Ave
- 4813 S 30th West Ave
- 4817 S 30th West Ave
- 4215 S 25th West Ave
- 4214 S 24th West Ave
- 4347 W 41st St
- 4229 S 35th West Ave
- 4233 S 35th Ave W
- 4233 S 35th West Ave
- 4237 S 35th West Ave
- 3419 W 42nd Place
- 3508 W 42nd Place
- 4219 S 35th West Ave
- 4243 S 35th West Ave
- 3503 W 42nd Place
- 4215 S 35th West Ave
- 3510 W 42nd Place
- 4224 S 34th West Ave
- 4220 S 34th West Ave
- 4252 S 35th West Ave
- 3514 W 42nd Place
- 3509 W 42nd Place
- 4216 S 34th West Ave
- 0 S 35th Ave Unit 2205508
- 3513 W 42nd Place
- 4211 S 35th West Ave