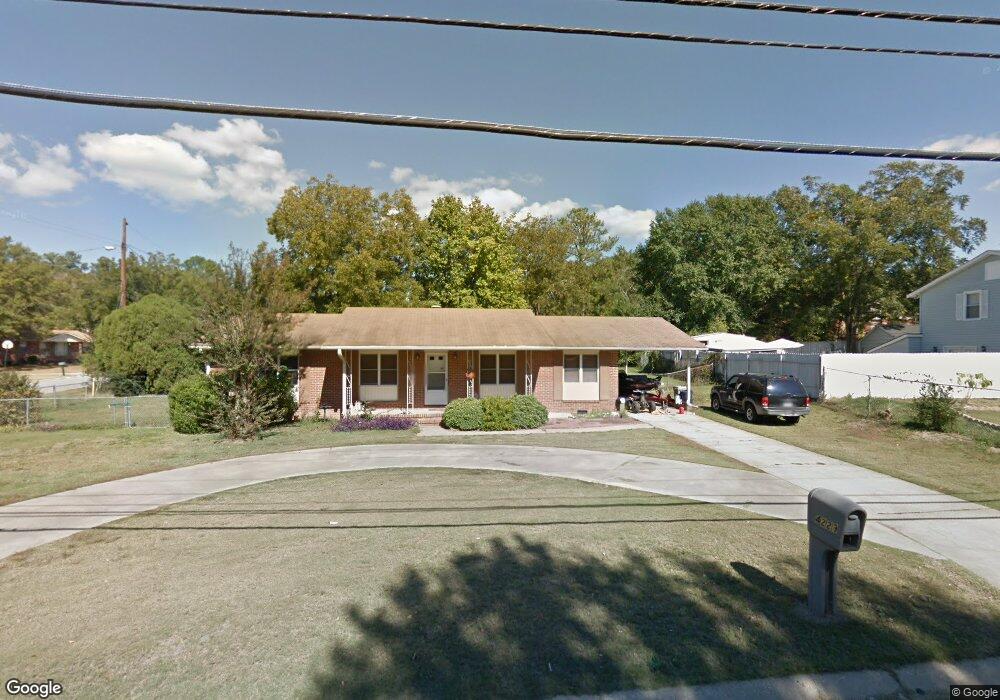
4229 Weems Rd Columbus, GA 31909
North Columbus NeighborhoodEstimated Value: $192,495 - $226,000
3
Beds
3
Baths
1,375
Sq Ft
$150/Sq Ft
Est. Value
About This Home
This home is located at 4229 Weems Rd, Columbus, GA 31909 and is currently estimated at $206,374, approximately $150 per square foot. 4229 Weems Rd is a home located in Muscogee County with nearby schools including Blanchard Elementary School, Blackmon Road Middle School, and Hardaway High School.
Ownership History
Date
Name
Owned For
Owner Type
Purchase Details
Closed on
Jul 21, 2017
Sold by
Secretary Of Hsng & Urban Dev Wa Dc
Bought by
Moore Debra Bennett
Current Estimated Value
Home Financials for this Owner
Home Financials are based on the most recent Mortgage that was taken out on this home.
Original Mortgage
$65,200
Outstanding Balance
$44,493
Interest Rate
3.9%
Mortgage Type
New Conventional
Estimated Equity
$161,881
Purchase Details
Closed on
Oct 24, 2016
Bought by
Sec Of Housing & Urban D
Purchase Details
Closed on
Aug 2, 2016
Sold by
Landon Richard
Bought by
Bank Of America
Purchase Details
Closed on
Jan 20, 2010
Sold by
Stewart Michael F and Stewart Rosita C
Bought by
French Richard Landon
Home Financials for this Owner
Home Financials are based on the most recent Mortgage that was taken out on this home.
Original Mortgage
$125,681
Interest Rate
5.25%
Mortgage Type
FHA
Create a Home Valuation Report for This Property
The Home Valuation Report is an in-depth analysis detailing your home's value as well as a comparison with similar homes in the area
Home Values in the Area
Average Home Value in this Area
Purchase History
| Date | Buyer | Sale Price | Title Company |
|---|---|---|---|
| Moore Debra Bennett | $75,000 | -- | |
| Sec Of Housing & Urban D | -- | -- | |
| Bank Of America | $135,125 | -- | |
| French Richard Landon | $128,000 | None Available |
Source: Public Records
Mortgage History
| Date | Status | Borrower | Loan Amount |
|---|---|---|---|
| Open | Moore Debra Bennett | $65,200 | |
| Previous Owner | French Richard Landon | $125,681 |
Source: Public Records
Tax History
| Year | Tax Paid | Tax Assessment Tax Assessment Total Assessment is a certain percentage of the fair market value that is determined by local assessors to be the total taxable value of land and additions on the property. | Land | Improvement |
|---|---|---|---|---|
| 2025 | $2,364 | $60,392 | $10,120 | $50,272 |
| 2024 | $2,364 | $60,392 | $10,120 | $50,272 |
| 2023 | $238 | $60,392 | $10,120 | $50,272 |
| 2022 | $2,079 | $50,924 | $10,120 | $40,804 |
| 2021 | $1,898 | $46,392 | $10,120 | $36,272 |
| 2020 | $1,895 | $46,392 | $10,120 | $36,272 |
| 2019 | $1,901 | $46,392 | $10,120 | $36,272 |
| 2018 | $1,229 | $30,000 | $6,600 | $23,400 |
| 2017 | $1,889 | $45,952 | $10,120 | $35,832 |
| 2016 | $2,112 | $51,199 | $6,991 | $44,208 |
| 2015 | $1,567 | $51,199 | $6,991 | $44,208 |
| 2014 | $1,569 | $51,199 | $6,991 | $44,208 |
| 2013 | -- | $51,199 | $6,991 | $44,208 |
Source: Public Records
Map
Nearby Homes
- 6411 Michael Ave
- 4507 N Oaks Dr
- 4202 Cheshire Bridge Rd
- 6629 Benson Dr
- 3670 Weems Rd
- 6697 Springlake Dr
- 6143 Brooklet Dr
- 4465 Weems Rd
- 3646 Weems Rd
- 4001 Twilight Dr
- 4449 Miller
- 4174 Will Rhoades Dr
- 4627 Wimbish Ct
- 3616 Weems Rd
- 6607 Hillbrook Ave
- 6104 Windsor Dr
- 2 Biltmore Ct
- 6421 Lemans Ln
- 4320 Canady St
- 4802 Basswood Dr
Your Personal Tour Guide
Ask me questions while you tour the home.