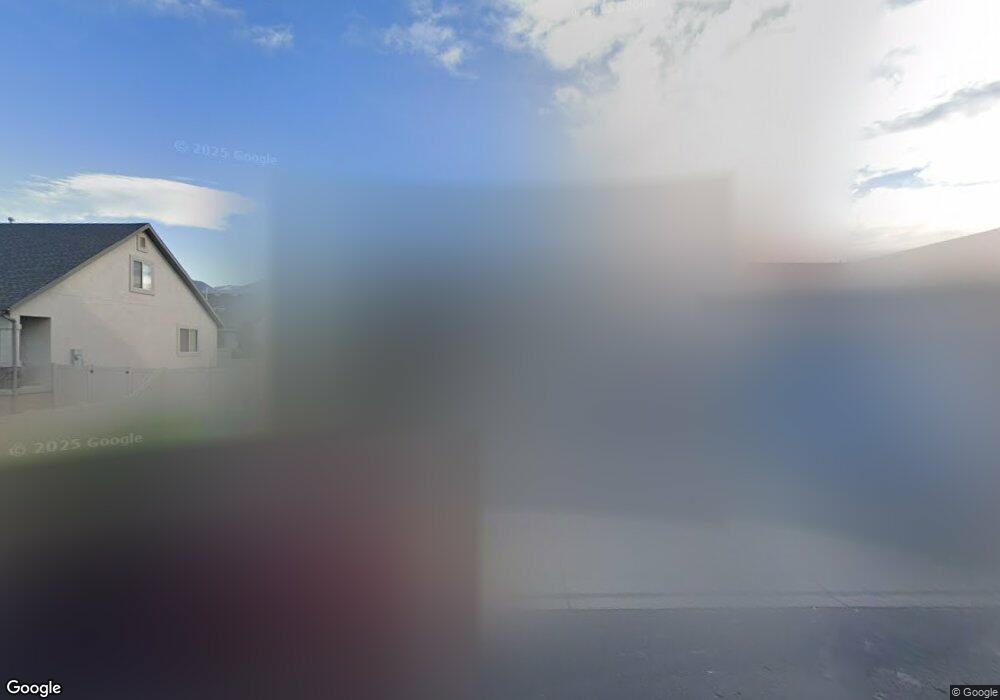
423 350 S Spanish Fork, UT 84660
Estimated Value: $557,676 - $580,000
6
Beds
4
Baths
2,687
Sq Ft
$211/Sq Ft
Est. Value
About This Home
This home is located at 423 350 S, Spanish Fork, UT 84660 and is currently estimated at $568,169, approximately $211 per square foot. 423 350 S is a home located in Utah County with nearby schools including Riverview Elementary School, Spanish Fork Jr High School, and Spanish Fork High School.
Ownership History
Date
Name
Owned For
Owner Type
Purchase Details
Closed on
Mar 27, 2022
Sold by
Hiss Casey D and Hiss Sahra L
Bought by
Casey And Sahra Hiss Family Trust
Current Estimated Value
Home Financials for this Owner
Home Financials are based on the most recent Mortgage that was taken out on this home.
Original Mortgage
$183,000
Outstanding Balance
$172,200
Interest Rate
4.42%
Mortgage Type
New Conventional
Estimated Equity
$395,969
Purchase Details
Closed on
Aug 26, 2014
Sold by
Hiss Casey and Hiss Sahra
Bought by
The Casey & Sahra Hiss Family Trust
Purchase Details
Closed on
Aug 28, 2009
Sold by
Utah Home Builders Llc
Bought by
Hiss Casey and Hiss Sahra
Home Financials for this Owner
Home Financials are based on the most recent Mortgage that was taken out on this home.
Original Mortgage
$188,826
Interest Rate
5.09%
Mortgage Type
FHA
Create a Home Valuation Report for This Property
The Home Valuation Report is an in-depth analysis detailing your home's value as well as a comparison with similar homes in the area
Home Values in the Area
Average Home Value in this Area
Purchase History
| Date | Buyer | Sale Price | Title Company |
|---|---|---|---|
| Casey And Sahra Hiss Family Trust | -- | Titan Title | |
| Hiss Casey D | -- | Titan Title | |
| The Casey & Sahra Hiss Family Trust | -- | None Available | |
| Hiss Casey | -- | Affiliated First Title Comp |
Source: Public Records
Mortgage History
| Date | Status | Borrower | Loan Amount |
|---|---|---|---|
| Open | Hiss Casey D | $183,000 | |
| Previous Owner | Hiss Casey | $188,826 |
Source: Public Records
Tax History Compared to Growth
Tax History
| Year | Tax Paid | Tax Assessment Tax Assessment Total Assessment is a certain percentage of the fair market value that is determined by local assessors to be the total taxable value of land and additions on the property. | Land | Improvement |
|---|---|---|---|---|
| 2025 | $2,388 | $277,145 | $161,400 | $342,500 |
| 2024 | $2,388 | $246,125 | $0 | $0 |
| 2023 | $2,440 | $251,735 | $0 | $0 |
| 2022 | $2,631 | $266,255 | $0 | $0 |
| 2021 | $2,273 | $368,000 | $96,400 | $271,600 |
| 2020 | $2,169 | $341,400 | $87,600 | $253,800 |
| 2019 | $2,015 | $333,700 | $79,900 | $253,800 |
| 2018 | $1,884 | $301,600 | $73,500 | $228,100 |
| 2017 | $1,866 | $160,600 | $0 | $0 |
| 2016 | $1,655 | $140,525 | $0 | $0 |
| 2015 | $1,484 | $124,520 | $0 | $0 |
| 2014 | $1,456 | $122,595 | $0 | $0 |
Source: Public Records
Map
Nearby Homes