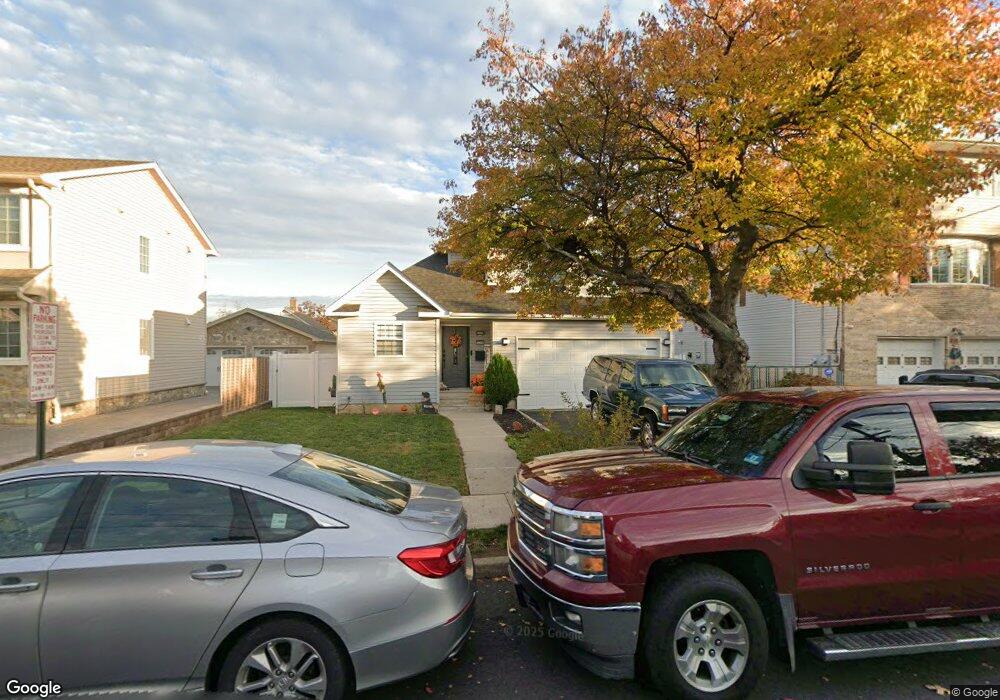
423 8th St Carlstadt, NJ 07072
Estimated Value: $659,476 - $724,000
--
Bed
--
Bath
1,562
Sq Ft
$444/Sq Ft
Est. Value
About This Home
This home is located at 423 8th St, Carlstadt, NJ 07072 and is currently estimated at $693,119, approximately $443 per square foot. 423 8th St is a home located in Bergen County with nearby schools including Carlstadt Public School, Henry P Becton Regional High School, and Montessori School of East Rutherford.
Ownership History
Date
Name
Owned For
Owner Type
Purchase Details
Closed on
May 10, 2024
Sold by
Kronyak Cathy S and Kronyak Kyle
Bought by
Monaco Megan L and Monaco John F
Current Estimated Value
Home Financials for this Owner
Home Financials are based on the most recent Mortgage that was taken out on this home.
Original Mortgage
$627,000
Outstanding Balance
$618,107
Interest Rate
6.82%
Mortgage Type
New Conventional
Estimated Equity
$75,012
Purchase Details
Closed on
Aug 25, 2015
Sold by
Kronyak Cathy S and Kronyak Kyle
Bought by
Kronyak Cathy S and Kronyak Kyle
Purchase Details
Closed on
Mar 26, 2008
Create a Home Valuation Report for This Property
The Home Valuation Report is an in-depth analysis detailing your home's value as well as a comparison with similar homes in the area
Home Values in the Area
Average Home Value in this Area
Purchase History
| Date | Buyer | Sale Price | Title Company |
|---|---|---|---|
| Monaco Megan L | $660,000 | North Bergen Title | |
| Monaco Megan L | $660,000 | North Bergen Title | |
| Kronyak Cathy S | $93,989 | -- | |
| -- | -- | -- |
Source: Public Records
Mortgage History
| Date | Status | Borrower | Loan Amount |
|---|---|---|---|
| Open | Monaco Megan L | $627,000 | |
| Closed | Monaco Megan L | $627,000 |
Source: Public Records
Tax History Compared to Growth
Tax History
| Year | Tax Paid | Tax Assessment Tax Assessment Total Assessment is a certain percentage of the fair market value that is determined by local assessors to be the total taxable value of land and additions on the property. | Land | Improvement |
|---|---|---|---|---|
| 2025 | $9,180 | $574,800 | $247,500 | $327,300 |
| 2024 | $8,325 | $552,700 | $235,000 | $317,700 |
| 2023 | $8,018 | $506,100 | $207,500 | $298,600 |
| 2022 | $8,018 | $475,000 | $190,000 | $285,000 |
| 2021 | $8,169 | $450,600 | $177,500 | $273,100 |
| 2020 | $7,696 | $433,600 | $172,500 | $261,100 |
| 2019 | $7,606 | $414,500 | $170,000 | $244,500 |
| 2018 | $7,871 | $409,500 | $167,500 | $242,000 |
| 2017 | $7,675 | $402,700 | $165,000 | $237,700 |
| 2016 | $8,294 | $390,100 | $150,000 | $240,100 |
| 2015 | $8,075 | $390,100 | $150,000 | $240,100 |
| 2014 | $7,767 | $390,100 | $150,000 | $240,100 |
Source: Public Records
Map
Nearby Homes
- 344 10th St
- 522 9th St
- 426 Broad St
- 451 Hoboken Rd
- 340 Marsan Dr
- 60 Prospect Terrace
- 38 Hackensack St
- 30 Humboldt St
- 327 Madison St
- 53 Hackensack St
- 233 Paterson Ave
- 88 Columbia St
- 409 Washington St
- 507 Washington St
- 592 Central Ave
- 89 Rose St
- 573 Anderson Ave
- 58 Mozart St
- 148 Hackensack St
- 167 Columbia St