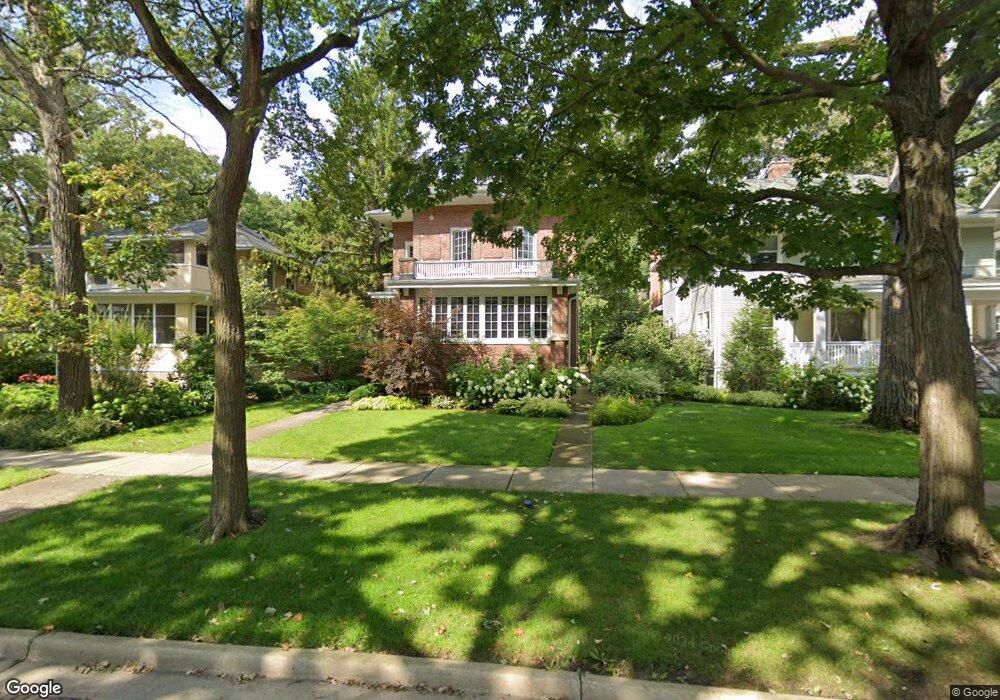
423 8th St Wilmette, IL 60091
Estimated Value: $1,475,901 - $1,783,000
--
Bed
4
Baths
2,996
Sq Ft
$537/Sq Ft
Est. Value
About This Home
This home is located at 423 8th St, Wilmette, IL 60091 and is currently estimated at $1,609,725, approximately $537 per square foot. 423 8th St is a home located in Cook County with nearby schools including Central Elementary School, Highcrest Middle School, and Wilmette Junior High School.
Ownership History
Date
Name
Owned For
Owner Type
Purchase Details
Closed on
Oct 12, 2023
Sold by
Chicago Title Land Trust Company
Bought by
Susan Spoeri Trust and John W Spoeri Trust
Current Estimated Value
Purchase Details
Closed on
Jun 29, 2001
Sold by
Clark Kimberly
Bought by
Palos Bank & Trust Company and Trust #1-5125
Home Financials for this Owner
Home Financials are based on the most recent Mortgage that was taken out on this home.
Original Mortgage
$275,000
Interest Rate
7.2%
Mortgage Type
Purchase Money Mortgage
Purchase Details
Closed on
Mar 19, 1996
Sold by
Rust Mark E and Clark Rust Kimberly
Bought by
Rust Kimberly Clark and Kimberly Clark Rust Estate Trust
Create a Home Valuation Report for This Property
The Home Valuation Report is an in-depth analysis detailing your home's value as well as a comparison with similar homes in the area
Home Values in the Area
Average Home Value in this Area
Purchase History
| Date | Buyer | Sale Price | Title Company |
|---|---|---|---|
| Susan Spoeri Trust | -- | None Listed On Document | |
| Palos Bank & Trust Company | $972,500 | -- | |
| Rust Kimberly Clark | -- | -- |
Source: Public Records
Mortgage History
| Date | Status | Borrower | Loan Amount |
|---|---|---|---|
| Previous Owner | Palos Bank & Trust Company | $275,000 |
Source: Public Records
Tax History
| Year | Tax Paid | Tax Assessment Tax Assessment Total Assessment is a certain percentage of the fair market value that is determined by local assessors to be the total taxable value of land and additions on the property. | Land | Improvement |
|---|---|---|---|---|
| 2025 | $21,630 | $143,000 | $34,125 | $108,875 |
| 2024 | $21,630 | $101,288 | $28,875 | $72,413 |
| 2023 | $22,742 | $112,044 | $28,875 | $83,169 |
| 2022 | $22,742 | $112,044 | $28,875 | $83,169 |
| 2021 | $17,933 | $75,021 | $23,100 | $51,921 |
| 2020 | $19,046 | $80,114 | $23,100 | $57,014 |
| 2019 | $21,132 | $98,809 | $23,100 | $75,709 |
| 2018 | $18,956 | $85,862 | $19,950 | $65,912 |
| 2017 | $21,195 | $95,000 | $19,950 | $75,050 |
| 2016 | $21,103 | $99,584 | $19,950 | $79,634 |
| 2015 | $21,275 | $88,321 | $16,537 | $71,784 |
| 2014 | $20,949 | $88,321 | $16,537 | $71,784 |
| 2013 | $19,992 | $88,321 | $16,537 | $71,784 |
Source: Public Records
Map
Nearby Homes
- 526 Linden Ave
- 420 Linden Ave Unit 502
- 414 Laurel Ave
- 512 Central Ave
- 606 5th St Unit 606
- 339 Greenleaf Ave Unit D
- 1209 Maple Ave
- 922 Forest Ave
- 2647 Poplar Ave
- 325 Central Ave
- 2508 Isabella St
- 1241 Maple Ave
- 1119 Forest Ave
- 611 Elmwood Ave
- 2500 Thayer St
- 621 Green Bay Rd
- 2611 Walnut Ave
- 925 Ashland Ave
- 2515 Prairie Ave Unit 1E
- 2108 Harrison St
Your Personal Tour Guide
Ask me questions while you tour the home.