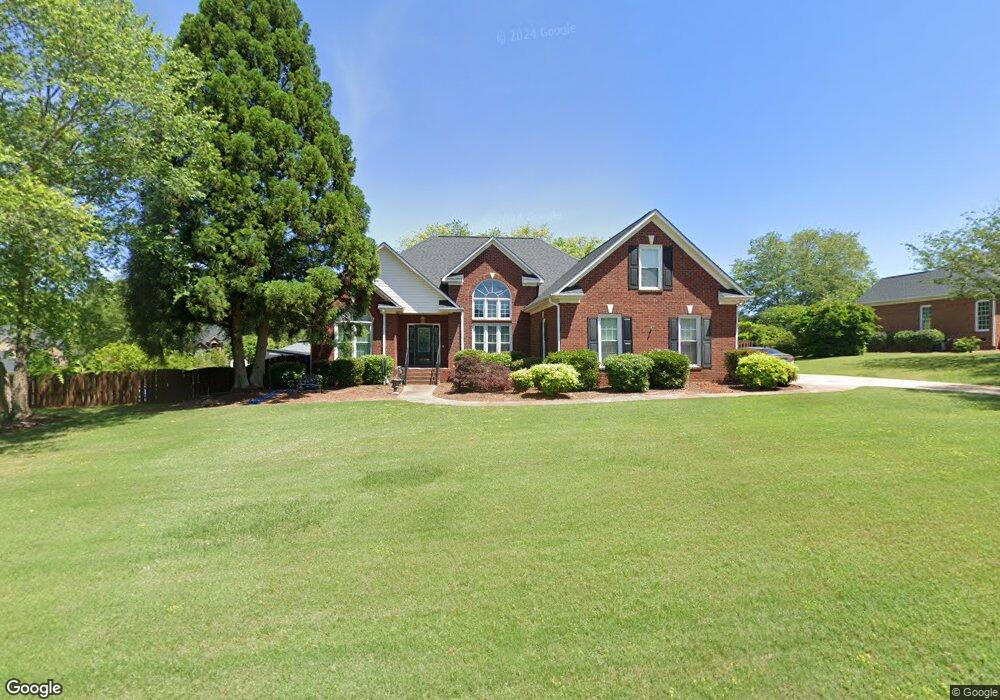
423 Battery Row Boiling Springs, SC 29316
Estimated Value: $403,000 - $449,000
3
Beds
2
Baths
2,212
Sq Ft
$189/Sq Ft
Est. Value
About This Home
This home is located at 423 Battery Row, Boiling Springs, SC 29316 and is currently estimated at $417,950, approximately $188 per square foot. 423 Battery Row is a home located in Spartanburg County with nearby schools including Boiling Springs Elementary School, Rainbow Lake Middle School, and Boiling Springs High School.
Ownership History
Date
Name
Owned For
Owner Type
Purchase Details
Closed on
Sep 27, 2006
Sold by
Weichert Relocation Resources Inc
Bought by
Smiley Andrew D and Smiley Tammy R
Current Estimated Value
Home Financials for this Owner
Home Financials are based on the most recent Mortgage that was taken out on this home.
Original Mortgage
$18,440
Interest Rate
6.36%
Mortgage Type
Unknown
Purchase Details
Closed on
Aug 19, 2006
Sold by
Hill Glenn A and Hill Lisa S
Bought by
Weichert Relocation Resources Inc
Home Financials for this Owner
Home Financials are based on the most recent Mortgage that was taken out on this home.
Original Mortgage
$18,440
Interest Rate
6.36%
Mortgage Type
Unknown
Purchase Details
Closed on
Feb 6, 2001
Sold by
Weizenecker Homes Inc
Bought by
Hill Glenn A and Hill Lisa S
Create a Home Valuation Report for This Property
The Home Valuation Report is an in-depth analysis detailing your home's value as well as a comparison with similar homes in the area
Home Values in the Area
Average Home Value in this Area
Purchase History
| Date | Buyer | Sale Price | Title Company |
|---|---|---|---|
| Smiley Andrew D | $242,200 | None Available | |
| Weichert Relocation Resources Inc | $242,200 | None Available | |
| Hill Glenn A | $214,600 | -- |
Source: Public Records
Mortgage History
| Date | Status | Borrower | Loan Amount |
|---|---|---|---|
| Closed | Smiley Andrew D | $18,440 |
Source: Public Records
Tax History Compared to Growth
Tax History
| Year | Tax Paid | Tax Assessment Tax Assessment Total Assessment is a certain percentage of the fair market value that is determined by local assessors to be the total taxable value of land and additions on the property. | Land | Improvement |
|---|---|---|---|---|
| 2025 | $2,055 | $13,064 | $790 | $12,274 |
| 2024 | $2,055 | $13,064 | $790 | $12,274 |
| 2023 | $2,055 | $13,064 | $790 | $12,274 |
| 2022 | $1,836 | $11,360 | $600 | $10,760 |
| 2021 | $1,722 | $10,648 | $600 | $10,048 |
| 2020 | $1,699 | $10,648 | $600 | $10,048 |
| 2019 | $1,699 | $10,648 | $600 | $10,048 |
| 2018 | $1,657 | $10,648 | $600 | $10,048 |
| 2017 | $1,508 | $9,632 | $600 | $9,032 |
| 2016 | $1,519 | $9,632 | $600 | $9,032 |
| 2015 | $1,530 | $9,632 | $600 | $9,032 |
| 2014 | $1,512 | $9,632 | $600 | $9,032 |
Source: Public Records
Map
Nearby Homes
- 3027 Toliver Trail
- 00 Mitchell Ln
- 513 Rainbow Lake Rd
- 1155 Mitchell Ln
- 1128 Cobbler Ln
- 1116 Cobbler Ln
- 1039 Glohaven Way
- 1308 Summer Gold Way
- 222 Mason Dr
- 744 Radner Way
- 1445 Bella Grace Ct
- 242 Mountain Range Rd
- 1442 Bella Grace Ct
- 1422 Bella Grace Ct
- 1418 Bella Grace Ct
- 867 Orchard Valley Ln
- 945 Riverland Woods Trail
- 309 Silhouette Trace
- 1341 Wunder Way
- 333 Cottage Mill Run
- 339 Cottage Mill Run
- 429 Battery Row
- 424 Battery Row
- 430 Battery Row
- 323 Cottage Mill Run
- 418 Battery Row
- 351 Cottage Mill Run
- 435 Battery Row
- 436 Battery Row
- 336 Cottage Mill Run
- 412 Battery Row
- 330 Cottage Mill Run
- 315 Cottage Mill Run
- 441 Battery Row
- 342 Cottage Mill Run
- 324 Cottage Mill Run
- 416 Carrington Dr
- 348 Cottage Mill Run
- 420 Carrington Dr