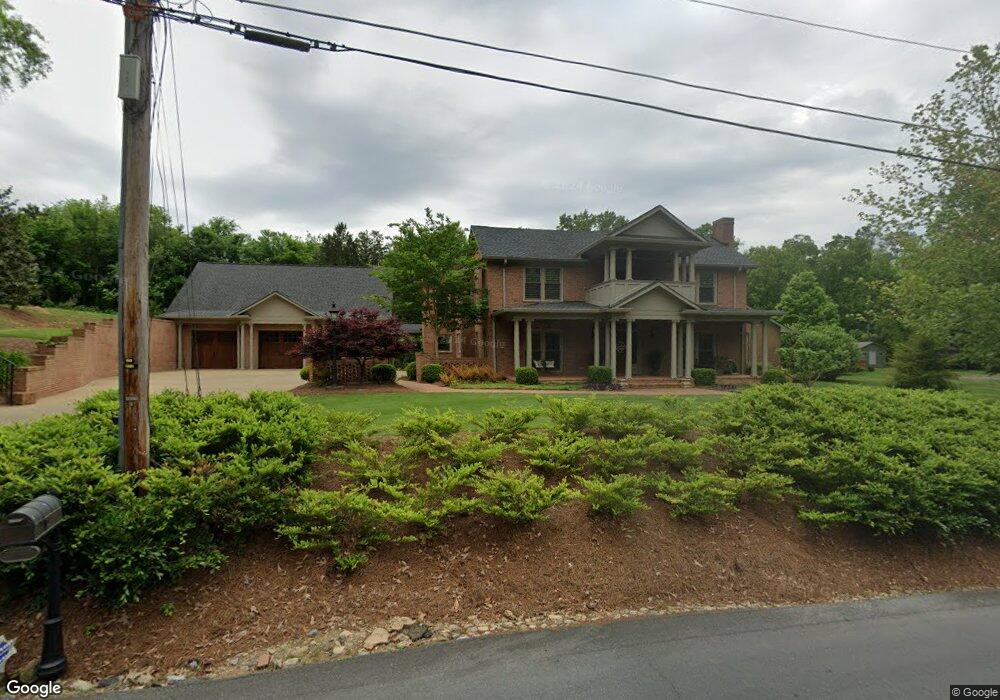
423 Boulevard Heights Calhoun, GA 30701
Estimated Value: $629,000 - $764,000
4
Beds
4
Baths
3,654
Sq Ft
$185/Sq Ft
Est. Value
About This Home
This home is located at 423 Boulevard Heights, Calhoun, GA 30701 and is currently estimated at $676,495, approximately $185 per square foot. 423 Boulevard Heights is a home located in Gordon County with nearby schools including Calhoun Primary School, Calhoun Elementary School, and Calhoun Middle School.
Ownership History
Date
Name
Owned For
Owner Type
Purchase Details
Closed on
Oct 2, 2017
Sold by
Frank D Mills
Bought by
Parker Kenneth and Parker Paula
Current Estimated Value
Home Financials for this Owner
Home Financials are based on the most recent Mortgage that was taken out on this home.
Original Mortgage
$356,000
Outstanding Balance
$297,440
Interest Rate
3.83%
Estimated Equity
$379,055
Purchase Details
Closed on
Jul 14, 2017
Sold by
Parker Kenneth H
Bought by
Parker Kenneth H and Parker Paula D A
Purchase Details
Closed on
Jun 25, 2009
Sold by
Smith Nita C
Bought by
Mills Frank D and Mills Summer S
Home Financials for this Owner
Home Financials are based on the most recent Mortgage that was taken out on this home.
Original Mortgage
$399,000
Interest Rate
4.88%
Mortgage Type
New Conventional
Purchase Details
Closed on
Mar 2, 2000
Bought by
Smith Nita C
Create a Home Valuation Report for This Property
The Home Valuation Report is an in-depth analysis detailing your home's value as well as a comparison with similar homes in the area
Home Values in the Area
Average Home Value in this Area
Purchase History
| Date | Buyer | Sale Price | Title Company |
|---|---|---|---|
| Parker Kenneth | $441,000 | -- | |
| Parker Kenneth H | -- | -- | |
| Parker Kenneth H | $441,000 | -- | |
| Mills Frank D | $399,000 | -- | |
| Smith Nita C | $33,000 | -- |
Source: Public Records
Mortgage History
| Date | Status | Borrower | Loan Amount |
|---|---|---|---|
| Open | Parker Kenneth | $356,000 | |
| Closed | Parker Kenneth | -- | |
| Previous Owner | Mills Frank D | $399,000 |
Source: Public Records
Tax History Compared to Growth
Tax History
| Year | Tax Paid | Tax Assessment Tax Assessment Total Assessment is a certain percentage of the fair market value that is determined by local assessors to be the total taxable value of land and additions on the property. | Land | Improvement |
|---|---|---|---|---|
| 2024 | $4,902 | $231,460 | $16,720 | $214,740 |
| 2023 | $4,205 | $206,660 | $15,960 | $190,700 |
| 2022 | $1,825 | $193,780 | $15,960 | $177,820 |
| 2021 | $3,099 | $163,700 | $15,960 | $147,740 |
| 2020 | $3,169 | $165,260 | $15,960 | $149,300 |
| 2019 | $3,159 | $165,260 | $15,960 | $149,300 |
| 2018 | $1,050 | $120,392 | $15,160 | $105,232 |
| 2017 | $1,021 | $103,896 | $11,400 | $92,496 |
| 2016 | $1,024 | $103,896 | $11,400 | $92,496 |
| 2015 | $1,016 | $101,776 | $11,400 | $90,376 |
| 2014 | $970 | $98,484 | $11,404 | $87,080 |
Source: Public Records
Map
Nearby Homes
- 0 Boulevard Heights
- 100 Dobbs St
- 504 Boulevard Heights
- 418 Boulevard Heights
- 508 Boulevard Heights
- 507 Boulevard Heights
- 415 E Line St
- 412 Boulevard Heights
- 100 Anabel Ln
- 100 Woodrow St
- 410 Boulevard Heights
- 409 E Line St
- 409 E Line St
- 612 Boulevard Heights
- 110 Woodrow St
- 0 Dobbs St Unit 5174366
- 0 Dobbs St Unit 5325902
- na E Line St
- E E Line St
- 515 Boulevard Heights