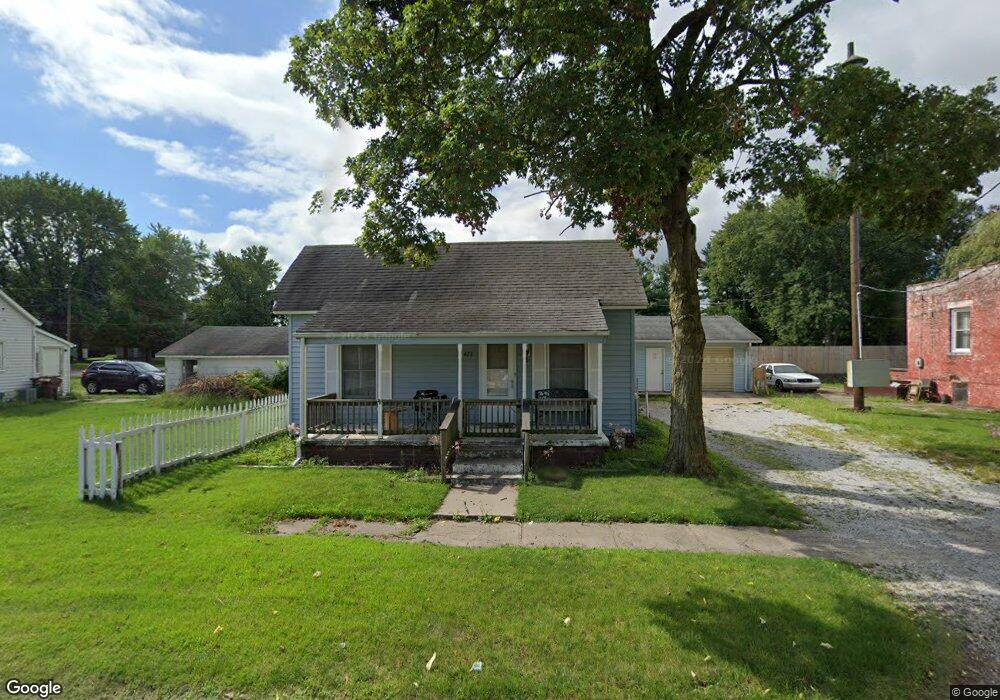
423 E 3rd St Clinton, IN 47842
Estimated Value: $126,000 - $150,695
3
Beds
3
Baths
2,400
Sq Ft
$58/Sq Ft
Est. Value
About This Home
This home is located at 423 E 3rd St, Clinton, IN 47842 and is currently estimated at $138,348, approximately $57 per square foot. 423 E 3rd St is a home located in Vermillion County with nearby schools including South Vermillion High School and Sacred Heart School.
Ownership History
Date
Name
Owned For
Owner Type
Purchase Details
Closed on
Jan 6, 2023
Sold by
Beverly Rentals Llc
Bought by
Wires Only Llc
Current Estimated Value
Home Financials for this Owner
Home Financials are based on the most recent Mortgage that was taken out on this home.
Original Mortgage
$1,680,000
Outstanding Balance
$1,539,929
Interest Rate
6.49%
Mortgage Type
Credit Line Revolving
Estimated Equity
-$1,401,581
Purchase Details
Closed on
Jun 8, 2012
Sold by
Vca Llc
Bought by
Beverly Rentals Llc
Create a Home Valuation Report for This Property
The Home Valuation Report is an in-depth analysis detailing your home's value as well as a comparison with similar homes in the area
Purchase History
| Date | Buyer | Sale Price | Title Company |
|---|---|---|---|
| Wires Only Llc | -- | None Listed On Document | |
| Beverly Rentals Llc | $15,000 | Antonini & Antonini | |
| Not Provided | $15,000 | -- |
Source: Public Records
Mortgage History
| Date | Status | Borrower | Loan Amount |
|---|---|---|---|
| Open | Wires Only Llc | $1,680,000 |
Source: Public Records
Tax History
| Year | Tax Paid | Tax Assessment Tax Assessment Total Assessment is a certain percentage of the fair market value that is determined by local assessors to be the total taxable value of land and additions on the property. | Land | Improvement |
|---|---|---|---|---|
| 2025 | $1,900 | $95,000 | $10,700 | $84,300 |
| 2024 | $1,900 | $95,000 | $10,700 | $84,300 |
| 2023 | $2,442 | $94,300 | $10,700 | $83,600 |
| 2022 | $1,906 | $95,300 | $10,700 | $84,600 |
| 2021 | $1,672 | $83,600 | $10,700 | $72,900 |
| 2020 | $2,032 | $101,600 | $15,800 | $85,800 |
| 2019 | $1,462 | $73,100 | $6,300 | $66,800 |
| 2018 | $1,528 | $76,400 | $6,300 | $70,100 |
| 2017 | $1,514 | $75,700 | $6,300 | $69,400 |
| 2016 | $1,514 | $75,700 | $6,300 | $69,400 |
| 2014 | $1,390 | $72,700 | $6,300 | $66,400 |
| 2013 | $1,390 | $65,200 | $6,300 | $58,900 |
Source: Public Records
Map
Nearby Homes
- 423 E 3rd St
- 305 S Washington St
- 437 E 3rd St
- 315 S Washington St
- 306 S Washington St
- 325 S Washington St
- 275 W Washington St
- 263 S Washington St
- 270 S Washington St
- 333 S Washington St
- 270 S Towne St
- 322 S Washington St
- 262 S Towne St
- 353 E 3rd St
- 260 W Washington St
- 251 S Washington St
- 341 S Washington St
- 341 S Washington St
- 263 S 2nd St
- 342 S Washington St
Your Personal Tour Guide
Ask me questions while you tour the home.