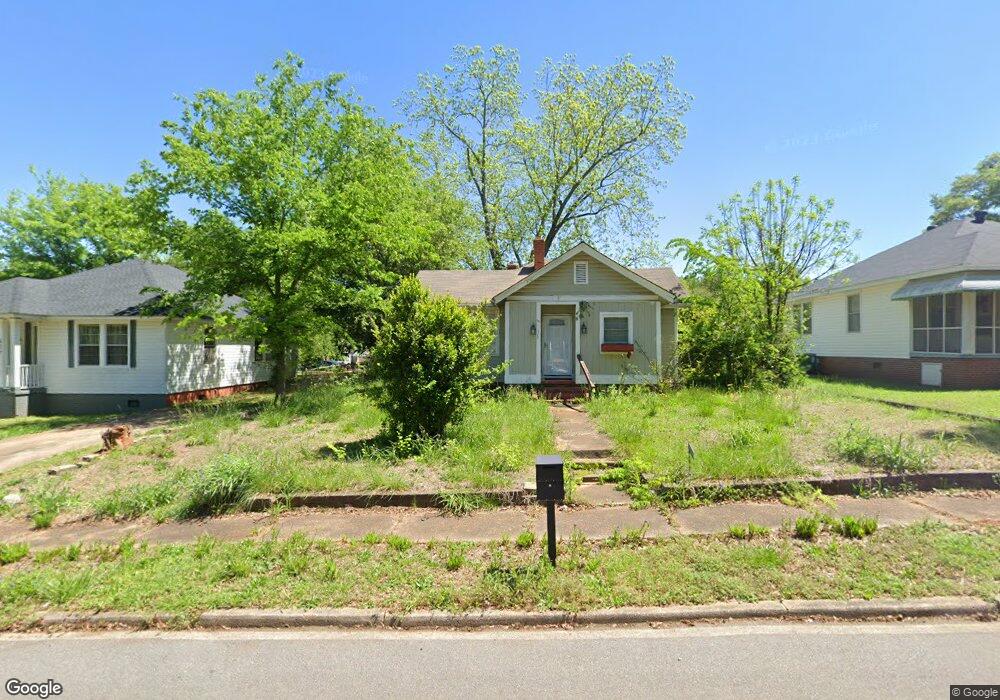
423 E St Thomaston, GA 30286
Estimated Value: $90,000 - $96,000
2
Beds
1
Bath
936
Sq Ft
$100/Sq Ft
Est. Value
About This Home
This home is located at 423 E St, Thomaston, GA 30286 and is currently estimated at $93,656, approximately $100 per square foot. 423 E St is a home located in Upson County with nearby schools including Upson-Lee South Elementary School, Upson-Lee North Elementary School, and Upson-Lee Middle School.
Ownership History
Date
Name
Owned For
Owner Type
Purchase Details
Closed on
Dec 2, 2016
Sold by
Larry E
Bought by
Baxter Mona Lisa Ash
Current Estimated Value
Purchase Details
Closed on
Nov 15, 2013
Sold by
Johnson Jeffery J
Bought by
Batchelor Larry E
Home Financials for this Owner
Home Financials are based on the most recent Mortgage that was taken out on this home.
Original Mortgage
$16,000
Interest Rate
4.31%
Mortgage Type
New Conventional
Purchase Details
Closed on
Oct 14, 2005
Sold by
Murphy Claude
Bought by
Johnson Jeffery J and Johnson Soon Ju
Home Financials for this Owner
Home Financials are based on the most recent Mortgage that was taken out on this home.
Original Mortgage
$42,970
Interest Rate
5.71%
Mortgage Type
New Conventional
Create a Home Valuation Report for This Property
The Home Valuation Report is an in-depth analysis detailing your home's value as well as a comparison with similar homes in the area
Purchase History
| Date | Buyer | Sale Price | Title Company |
|---|---|---|---|
| Baxter Mona Lisa Ash | $20,000 | -- | |
| Batchelor Larry E | $20,000 | -- | |
| Johnson Jeffery J | $52,000 | -- |
Source: Public Records
Mortgage History
| Date | Status | Borrower | Loan Amount |
|---|---|---|---|
| Previous Owner | Batchelor Larry E | $16,000 | |
| Previous Owner | Johnson Jeffery J | $42,970 |
Source: Public Records
Tax History
| Year | Tax Paid | Tax Assessment Tax Assessment Total Assessment is a certain percentage of the fair market value that is determined by local assessors to be the total taxable value of land and additions on the property. | Land | Improvement |
|---|---|---|---|---|
| 2025 | $595 | $27,302 | $3,200 | $24,102 |
| 2024 | $595 | $21,487 | $3,200 | $18,287 |
| 2023 | $105 | $21,994 | $3,200 | $18,794 |
| 2022 | $448 | $17,650 | $3,200 | $14,450 |
| 2021 | $428 | $16,529 | $3,200 | $13,329 |
| 2020 | $329 | $12,272 | $3,200 | $9,072 |
| 2019 | $373 | $13,215 | $4,800 | $8,415 |
| 2018 | $373 | $13,215 | $4,800 | $8,415 |
| 2017 | $230 | $8,416 | $1,600 | $6,816 |
| 2016 | $409 | $11,518 | $1,600 | $9,918 |
| 2015 | $420 | $11,896 | $1,600 | $10,296 |
| 2014 | $283 | $11,896 | $1,600 | $10,296 |
Source: Public Records
Map
Nearby Homes
- 458 E St
- 0 12th Ave Unit 10630351
- 100 Beaver Run Trace
- 119 F St
- 114 C St NE
- 74 E St
- 106 C St NE
- 228 R St NW
- 719 9th Ave
- 0 9th Ave Unit 10500756
- 115 Hillside Dr
- 146 O St NW
- 516 W Goodrich Ave
- 354 S Main St
- 119 S St NW
- 0 Goodrich Ave N Unit 10690948
- 600 4th Ave SW
- 03 Multiple Rental Houses
- 40 Edgewood Ave
- 129 R St SW
Your Personal Tour Guide
Ask me questions while you tour the home.