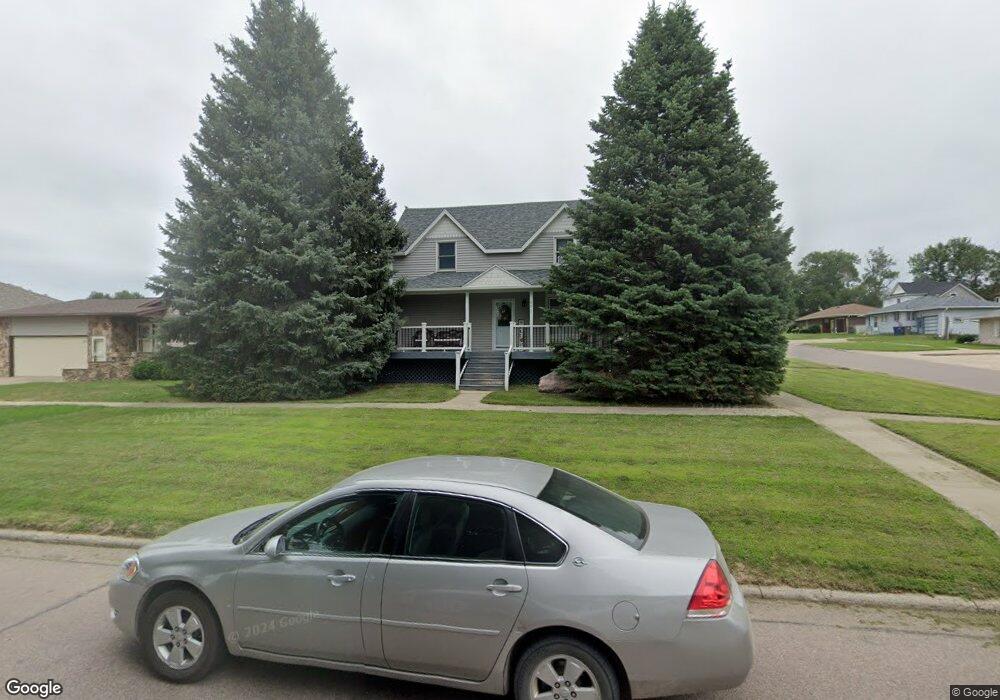
423 Fulton St Remsen, IA 51050
Estimated Value: $198,313 - $217,000
3
Beds
3
Baths
1,862
Sq Ft
$112/Sq Ft
Est. Value
About This Home
This home is located at 423 Fulton St, Remsen, IA 51050 and is currently estimated at $209,078, approximately $112 per square foot. 423 Fulton St is a home located in Plymouth County with nearby schools including Remsen-Union Elementary School, St. Catherine-St. Mary's Grade School, and Great Beginnings Preschool.
Ownership History
Date
Name
Owned For
Owner Type
Purchase Details
Closed on
Jul 6, 2018
Sold by
Sonnichsen Llc
Bought by
Wurht Dustin
Current Estimated Value
Purchase Details
Closed on
Apr 11, 2007
Sold by
American Bank Na
Bought by
Hancock Michael L and Hancock Jolene V
Home Financials for this Owner
Home Financials are based on the most recent Mortgage that was taken out on this home.
Original Mortgage
$41,600
Interest Rate
6.2%
Mortgage Type
New Conventional
Create a Home Valuation Report for This Property
The Home Valuation Report is an in-depth analysis detailing your home's value as well as a comparison with similar homes in the area
Purchase History
| Date | Buyer | Sale Price | Title Company |
|---|---|---|---|
| Wurht Dustin | $158,000 | -- | |
| Hancock Michael L | $52,000 | None Available |
Source: Public Records
Mortgage History
| Date | Status | Borrower | Loan Amount |
|---|---|---|---|
| Previous Owner | Hancock Michael L | $41,600 |
Source: Public Records
Tax History
| Year | Tax Paid | Tax Assessment Tax Assessment Total Assessment is a certain percentage of the fair market value that is determined by local assessors to be the total taxable value of land and additions on the property. | Land | Improvement |
|---|---|---|---|---|
| 2025 | $2,202 | $188,400 | $19,110 | $169,290 |
| 2024 | $1,954 | $174,810 | $19,110 | $155,700 |
| 2023 | $1,810 | $157,080 | $14,700 | $142,380 |
| 2022 | $1,806 | $124,580 | $14,700 | $109,880 |
| 2021 | $1,708 | $124,580 | $14,700 | $109,880 |
| 2020 | $1,708 | $111,850 | $14,700 | $97,150 |
Source: Public Records
Map
Nearby Homes
- 418 Madison St
- 609 S Washington St
- 621 Harrison St
- 626 Harrison St
- 622 S Washington St
- 14338 Quest Ave
- 38581 120th St
- 300 N Maple St
- 109 N Locust St
- 308 S Elm St
- 405 N Elm St
- 1550 Willow Run Blvd
- 303 N Ash St
- 308 N Beech St
- 34645 180th St
- 305 N Ames St
- 1335 2nd St SE
- 1201 2nd St SE
- 21 Park Village
- 15 Park Village
Your Personal Tour Guide
Ask me questions while you tour the home.