Estimated Value: $304,767 - $345,000
3
Beds
2
Baths
2,175
Sq Ft
$149/Sq Ft
Est. Value
About This Home
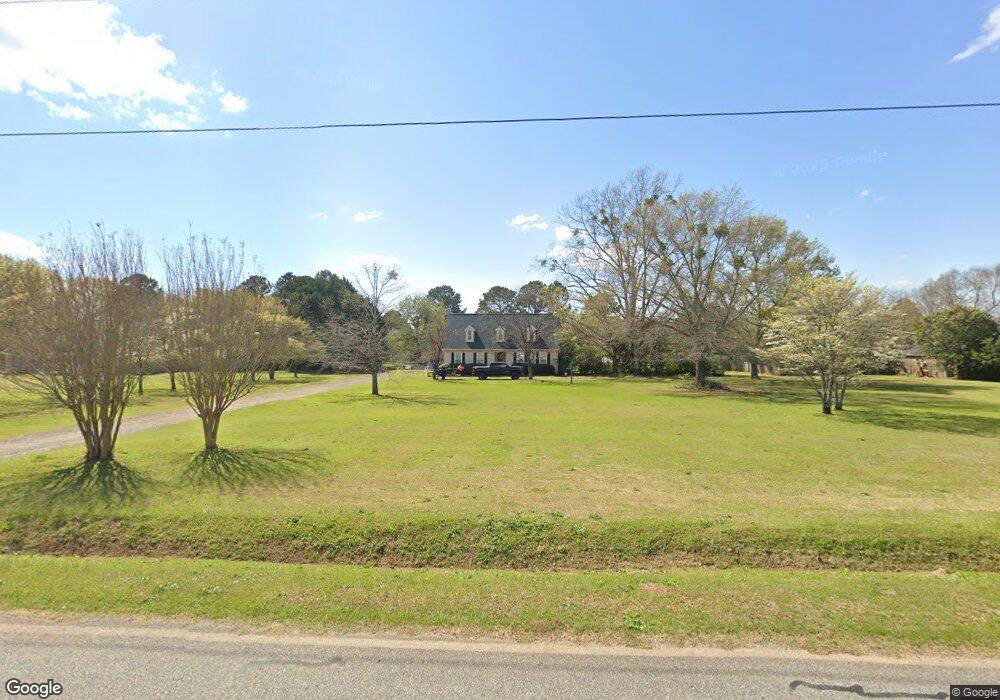
This home is located at 423 Joe Barnes Rd, Byron, GA 31008 and is currently estimated at $323,692, approximately $148 per square foot. 423 Joe Barnes Rd is a home located in Peach County with nearby schools including Byron Elementary School, Byron Middle School, and Peach County High School.
Ownership History
Date
Name
Owned For
Owner Type
Purchase Details
Closed on
Sep 17, 2021
Sold by
Executor Devereaux Mary Leigh
Bought by
Devereaux Mary Leigh
Current Estimated Value
Purchase Details
Closed on
Jan 29, 2018
Sold by
West Minna Ruth
Bought by
Devereaux Joseph Patrick and Devereaux Mary Leigh
Purchase Details
Closed on
Sep 14, 1999
Sold by
West Perry M and West Minn
Bought by
West Minna Ruth
Purchase Details
Closed on
Oct 30, 1998
Bought by
West Perry M and West Minna R
Purchase Details
Closed on
Aug 9, 1995
Bought by
Beaver Michael L and Beaver Melissa E
Purchase Details
Closed on
Jan 27, 1995
Bought by
Edwards Stephen M
Purchase Details
Closed on
Jul 21, 1988
Bought by
Rowland Ken D and Rowland Cynthia E
Purchase Details
Closed on
Nov 4, 1986
Bought by
Tyner Mary Ellen Mcbride
Create a Home Valuation Report for This Property
The Home Valuation Report is an in-depth analysis detailing your home's value as well as a comparison with similar homes in the area
Home Values in the Area
Average Home Value in this Area
Purchase History
| Date | Buyer | Sale Price | Title Company |
|---|---|---|---|
| Devereaux Mary Leigh | -- | -- | |
| Devereaux Joseph Patrick | -- | -- | |
| West Minna Ruth | -- | -- | |
| West Perry M | $125,000 | -- | |
| Beaver Michael L | $118,000 | -- | |
| Edwards Stephen M | $85,000 | -- | |
| Rowland Ken D | $7,500 | -- | |
| Tyner Mary Ellen Mcbride | $5,400 | -- |
Source: Public Records
Tax History
| Year | Tax Paid | Tax Assessment Tax Assessment Total Assessment is a certain percentage of the fair market value that is determined by local assessors to be the total taxable value of land and additions on the property. | Land | Improvement |
|---|---|---|---|---|
| 2025 | $2,721 | $97,240 | $16,480 | $80,760 |
| 2024 | $2,647 | $91,560 | $16,960 | $74,600 |
| 2023 | $2,322 | $78,680 | $15,120 | $63,560 |
| 2022 | $2,197 | $74,040 | $15,120 | $58,920 |
| 2021 | $2,149 | $62,280 | $15,120 | $47,160 |
| 2020 | $2,170 | $62,960 | $15,120 | $47,840 |
| 2019 | $2,179 | $62,960 | $15,120 | $47,840 |
| 2018 | $2,189 | $62,960 | $15,120 | $47,840 |
| 2017 | $2,136 | $62,960 | $15,120 | $47,840 |
| 2016 | $2,128 | $62,960 | $15,120 | $47,840 |
| 2015 | $2,128 | $62,960 | $15,120 | $47,840 |
| 2014 | $2,128 | $62,960 | $15,120 | $47,840 |
| 2013 | -- | $62,960 | $15,120 | $47,840 |
Source: Public Records
Map
Nearby Homes
- 251 Peregrine Dr
- 125 Peregrine Dr
- 35 Falcon Crest Way
- 68 Will Way
- 244 Shantz Way
- 242 Shantz Way
- 244 Shantz Way Unit (LOT A39)
- 242 Shantz Way Unit LOT A38
- V L Hwy 42 Unit LotWP001
- 420 Southland Trail
- 173 Preston Rd
- 251 Hampton Oaks Way
- 510 Southland Trail
- 551 Felton Wood Rd
- Lot 5 Trojan Way
- 538 Southland Trail
- Lot 6 Trojan Way
- 103 June Crest Ct
- Lot 2 Trojan Way
- 0 Highway 42 Unit 10576098
- 379 Joe Barnes Rd
- 465 Joe Barnes Rd
- 355 Joe Barnes Rd
- 505 Joe Barnes Rd
- 307 Joe Barnes Rd
- 942 Ross Rd
- 852 Ross Rd
- 994 Ross Rd
- 352 Joe Barnes Rd
- 589 Joe Barnes Rd
- 470 Joe Barnes Rd
- 265 Joe Barnes Rd
- 840 Ross Rd
- 231 Joe Barnes Rd
- 802 Ross Rd
- 1042 Ross Rd
- 663 Joe Barnes Rd
- 1084 Ross Rd
- 604 Joe Barnes Rd
- 901 Ross Rd
Your Personal Tour Guide
Ask me questions while you tour the home.