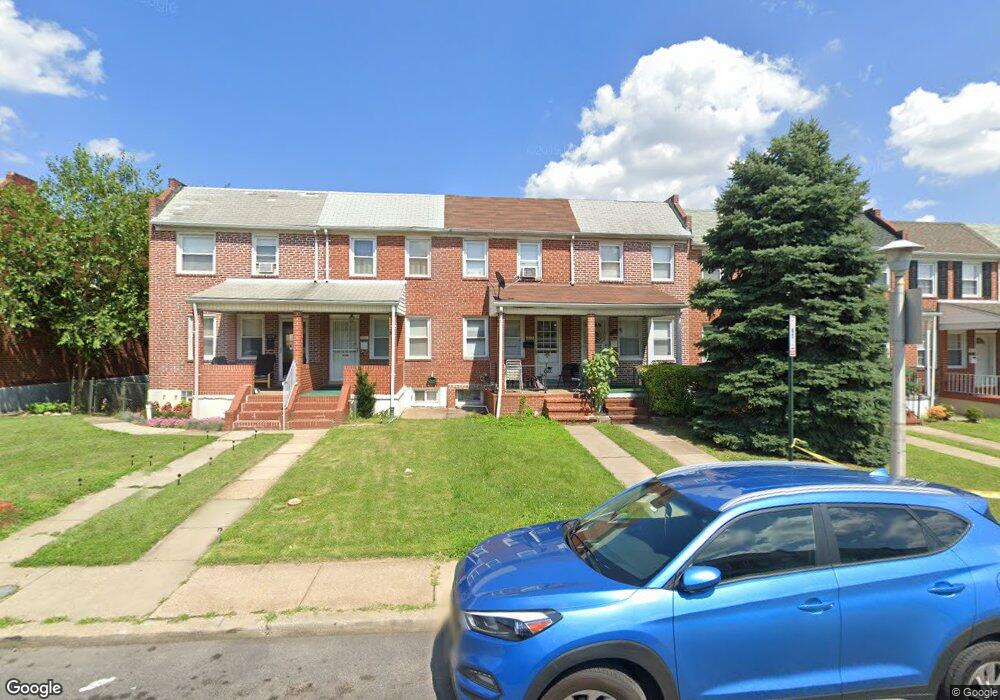
423 Joplin St Baltimore, MD 21224
Estimated Value: $127,937 - $149,000
Studio
1
Bath
840
Sq Ft
$165/Sq Ft
Est. Value
About This Home
This home is located at 423 Joplin St, Baltimore, MD 21224 and is currently estimated at $138,469, approximately $164 per square foot. 423 Joplin St is a home located in Baltimore City with nearby schools including Graceland Park-O'Donnell Heights Elementary/Middle School, Booker T. Washington Middle School, and Patterson High School.
Ownership History
Date
Name
Owned For
Owner Type
Purchase Details
Closed on
Mar 20, 2017
Sold by
Fannie Mae
Bought by
Zhang Ying
Current Estimated Value
Purchase Details
Closed on
Oct 16, 2016
Sold by
Cohn Edward S and Goldberg Stephen N
Bought by
Federal National Mortgage Association
Purchase Details
Closed on
Oct 13, 2016
Sold by
Eisel Harry Randall
Bought by
Federal National Mortgage Association and Fannie Mae
Purchase Details
Closed on
Apr 1, 2005
Sold by
Eisel Joseph F
Bought by
Eisel Harry Randall
Create a Home Valuation Report for This Property
The Home Valuation Report is an in-depth analysis detailing your home's value as well as a comparison with similar homes in the area
Purchase History
| Date | Buyer | Sale Price | Title Company |
|---|---|---|---|
| Zhang Ying | $60,316 | Servicelink Llc | |
| Federal National Mortgage Association | $55,872 | None Available | |
| Federal National Mortgage Association | -- | None Available | |
| Eisel Harry Randall | -- | -- |
Source: Public Records
Tax History
| Year | Tax Paid | Tax Assessment Tax Assessment Total Assessment is a certain percentage of the fair market value that is determined by local assessors to be the total taxable value of land and additions on the property. | Land | Improvement |
|---|---|---|---|---|
| 2025 | $2,366 | $108,800 | $25,000 | $83,800 |
| 2024 | $2,366 | $100,733 | -- | -- |
| 2023 | $2,177 | $92,667 | $0 | $0 |
| 2022 | $1,997 | $84,600 | $25,000 | $59,600 |
| 2021 | $1,997 | $84,600 | $25,000 | $59,600 |
| 2020 | $1,997 | $84,600 | $25,000 | $59,600 |
| 2019 | $2,053 | $87,400 | $25,000 | $62,400 |
| 2018 | $2,045 | $86,667 | $0 | $0 |
| 2017 | $2,028 | $85,933 | $0 | $0 |
| 2016 | $1,732 | $85,200 | $0 | $0 |
| 2015 | $1,732 | $85,200 | $0 | $0 |
| 2014 | $1,732 | $85,200 | $0 | $0 |
Source: Public Records
Map
Nearby Homes
Your Personal Tour Guide
Ask me questions while you tour the home.