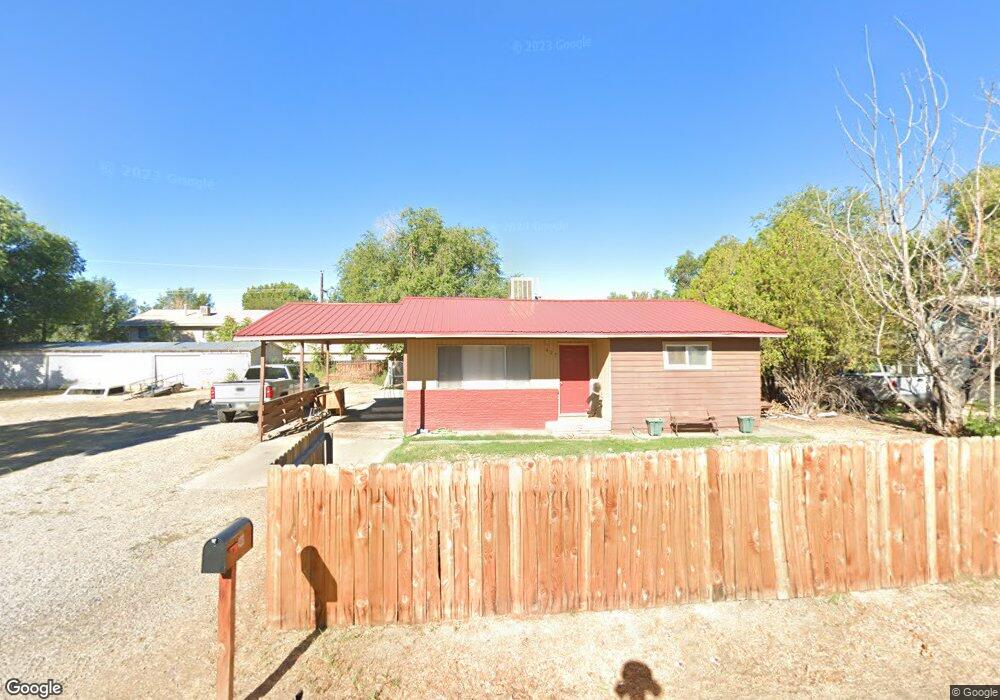
423 Lois St Clifton, CO 81520
Estimated Value: $242,000 - $260,089
2
Beds
1
Bath
888
Sq Ft
$282/Sq Ft
Est. Value
About This Home
This home is located at 423 Lois St, Clifton, CO 81520 and is currently estimated at $250,272, approximately $281 per square foot. 423 Lois St is a home located in Mesa County with nearby schools including Clifton Elementary School, Mount Garfield Middle School, and Palisade High School.
Ownership History
Date
Name
Owned For
Owner Type
Purchase Details
Closed on
May 29, 2015
Sold by
Cochran Joshua A
Bought by
Booth Randy W
Current Estimated Value
Home Financials for this Owner
Home Financials are based on the most recent Mortgage that was taken out on this home.
Original Mortgage
$69,000
Outstanding Balance
$53,366
Interest Rate
3.71%
Mortgage Type
New Conventional
Estimated Equity
$196,906
Purchase Details
Closed on
Apr 8, 2014
Sold by
Ashing Earl Harvey
Bought by
Cochran Joshua A
Purchase Details
Closed on
Oct 22, 2013
Sold by
Ashing Earl Harvey
Bought by
Cochran Joshua A
Home Financials for this Owner
Home Financials are based on the most recent Mortgage that was taken out on this home.
Original Mortgage
$57,500
Interest Rate
7%
Mortgage Type
Seller Take Back
Purchase Details
Closed on
Mar 12, 2012
Sold by
Ashing Clare G and Ashing Clair G
Bought by
The Clair G Ashing Trust
Create a Home Valuation Report for This Property
The Home Valuation Report is an in-depth analysis detailing your home's value as well as a comparison with similar homes in the area
Home Values in the Area
Average Home Value in this Area
Purchase History
| Date | Buyer | Sale Price | Title Company |
|---|---|---|---|
| Booth Randy W | $92,500 | None Available | |
| Cochran Joshua A | $60,000 | None Available | |
| Cochran Joshua A | $60,000 | Fidelity National Title Insu | |
| The Clair G Ashing Trust | -- | None Available |
Source: Public Records
Mortgage History
| Date | Status | Borrower | Loan Amount |
|---|---|---|---|
| Open | Booth Randy W | $69,000 | |
| Previous Owner | Cochran Joshua A | $57,500 |
Source: Public Records
Tax History Compared to Growth
Tax History
| Year | Tax Paid | Tax Assessment Tax Assessment Total Assessment is a certain percentage of the fair market value that is determined by local assessors to be the total taxable value of land and additions on the property. | Land | Improvement |
|---|---|---|---|---|
| 2024 | $1,008 | $12,570 | $4,660 | $7,910 |
| 2023 | $1,008 | $12,570 | $4,660 | $7,910 |
| 2022 | $977 | $11,930 | $4,690 | $7,240 |
| 2021 | $982 | $12,280 | $4,830 | $7,450 |
| 2020 | $766 | $9,570 | $3,220 | $6,350 |
| 2019 | $731 | $9,570 | $3,220 | $6,350 |
| 2018 | $739 | $8,880 | $2,700 | $6,180 |
| 2017 | $447 | $8,880 | $2,700 | $6,180 |
| 2016 | $447 | $6,160 | $2,990 | $3,170 |
| 2015 | $403 | $6,160 | $2,990 | $3,170 |
| 2014 | -- | $5,680 | $2,390 | $3,290 |
Source: Public Records
Map
Nearby Homes