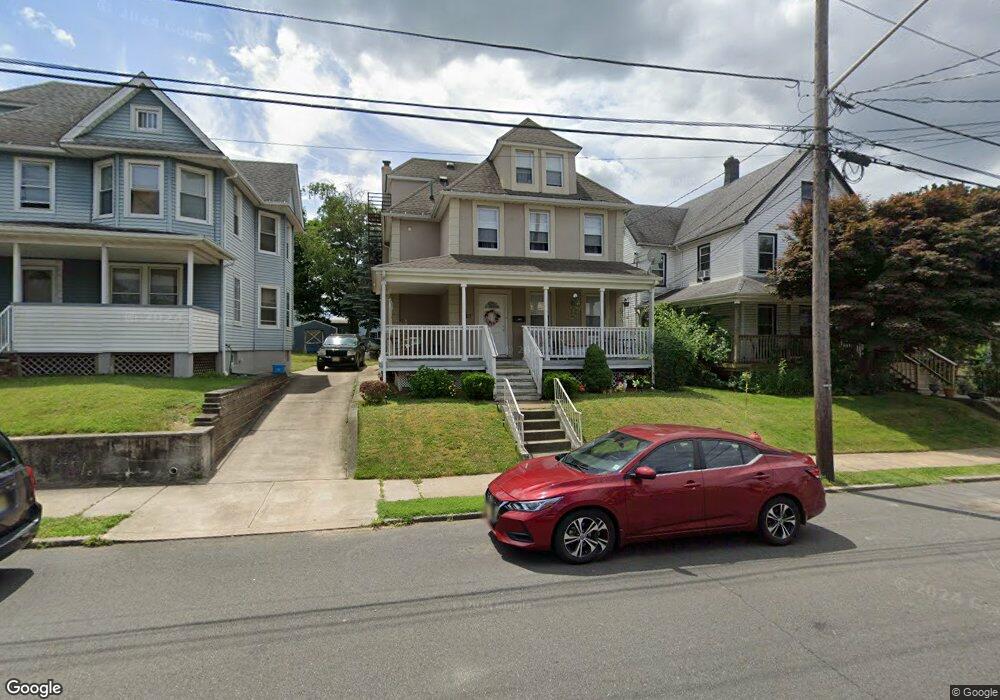
423 Louisa St Unit A South Amboy, NJ 08879
Estimated Value: $561,000 - $751,000
2
Beds
1
Bath
2,603
Sq Ft
$240/Sq Ft
Est. Value
About This Home
This home is located at 423 Louisa St Unit A, South Amboy, NJ 08879 and is currently estimated at $623,982, approximately $239 per square foot. 423 Louisa St Unit A is a home located in Middlesex County with nearby schools including South Amboy Elementary School, South Amboy Middle/High School, and St. Mary Elementary School.
Ownership History
Date
Name
Owned For
Owner Type
Purchase Details
Closed on
Jan 16, 2015
Sold by
Gorycki Piro Llc
Bought by
Czajkowski Tomasz
Current Estimated Value
Home Financials for this Owner
Home Financials are based on the most recent Mortgage that was taken out on this home.
Original Mortgage
$150,000
Outstanding Balance
$51,352
Interest Rate
3.37%
Mortgage Type
Adjustable Rate Mortgage/ARM
Estimated Equity
$572,630
Purchase Details
Closed on
Mar 31, 2009
Sold by
Mulligan Judith Ann and Mccue Charlene
Bought by
Gorycki Piro Llc
Home Financials for this Owner
Home Financials are based on the most recent Mortgage that was taken out on this home.
Original Mortgage
$230,000
Interest Rate
4.9%
Mortgage Type
Purchase Money Mortgage
Create a Home Valuation Report for This Property
The Home Valuation Report is an in-depth analysis detailing your home's value as well as a comparison with similar homes in the area
Home Values in the Area
Average Home Value in this Area
Purchase History
| Date | Buyer | Sale Price | Title Company |
|---|---|---|---|
| Czajkowski Tomasz | $273,000 | Coastal Title Agency Inc | |
| Gorycki Piro Llc | $230,000 | None Available |
Source: Public Records
Mortgage History
| Date | Status | Borrower | Loan Amount |
|---|---|---|---|
| Open | Czajkowski Tomasz | $150,000 | |
| Previous Owner | Gorycki Piro Llc | $230,000 |
Source: Public Records
Tax History Compared to Growth
Tax History
| Year | Tax Paid | Tax Assessment Tax Assessment Total Assessment is a certain percentage of the fair market value that is determined by local assessors to be the total taxable value of land and additions on the property. | Land | Improvement |
|---|---|---|---|---|
| 2025 | $9,139 | $284,800 | $128,500 | $156,300 |
| 2024 | $8,795 | $284,800 | $128,500 | $156,300 |
| 2023 | $8,795 | $284,800 | $128,500 | $156,300 |
| 2022 | $8,356 | $284,800 | $128,500 | $156,300 |
| 2021 | $8,216 | $284,800 | $128,500 | $156,300 |
| 2020 | $8,023 | $284,800 | $128,500 | $156,300 |
| 2019 | $7,895 | $284,800 | $128,500 | $156,300 |
| 2018 | $7,829 | $284,800 | $128,500 | $156,300 |
| 2017 | $7,704 | $284,800 | $128,500 | $156,300 |
| 2016 | $7,510 | $284,800 | $128,500 | $156,300 |
| 2015 | $7,564 | $284,800 | $128,500 | $156,300 |
| 2014 | $7,305 | $284,800 | $128,500 | $156,300 |
Source: Public Records
Map
Nearby Homes
- 433 Gordon St
- 442 Bordentown Ave
- 320 Parker Ave
- 411 Lefferts St
- 528 Catherine St
- 504 Colonel D B Kelly Way
- 504 Col Db Kelly Way
- 15 Bertram Ave
- 322 George St
- 380 Prospect St
- 161 Manor St
- 224 Gordon St
- 237 George St
- 123 S Stevens Ave
- 741 Bordentown Ave
- 503 Woodland Ave
- 101 N Stevens Ave
- 223 Henry St
- 805 Bayside Ct
- 251 Church St