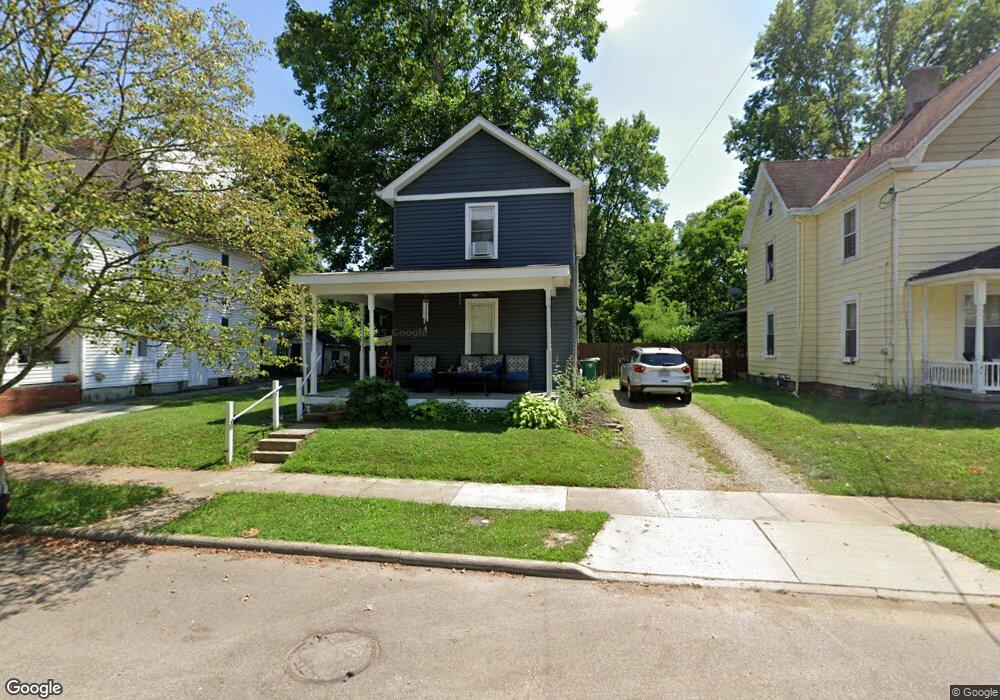
423 Main St Loveland, OH 45140
Estimated Value: $234,976 - $319,000
2
Beds
1
Bath
1,265
Sq Ft
$216/Sq Ft
Est. Value
About This Home
This home is located at 423 Main St, Loveland, OH 45140 and is currently estimated at $273,494, approximately $216 per square foot. 423 Main St is a home located in Hamilton County with nearby schools including Loveland Primary School, Loveland Elementary School, and Loveland Intermediate School.
Ownership History
Date
Name
Owned For
Owner Type
Purchase Details
Closed on
Nov 29, 2011
Sold by
Suder David M
Bought by
West 515
Current Estimated Value
Purchase Details
Closed on
Sep 25, 1997
Sold by
Barnett Sharon and Horton Sharon
Bought by
Kern Ii William
Home Financials for this Owner
Home Financials are based on the most recent Mortgage that was taken out on this home.
Original Mortgage
$50,000
Interest Rate
7.63%
Purchase Details
Closed on
Jul 2, 1997
Sold by
Espy Carroll John
Bought by
Morton Sharon
Create a Home Valuation Report for This Property
The Home Valuation Report is an in-depth analysis detailing your home's value as well as a comparison with similar homes in the area
Home Values in the Area
Average Home Value in this Area
Purchase History
| Date | Buyer | Sale Price | Title Company |
|---|---|---|---|
| West 515 | $152,500 | Terry Monnie Title | |
| Kern Ii William | $64,000 | -- | |
| Morton Sharon | -- | -- |
Source: Public Records
Mortgage History
| Date | Status | Borrower | Loan Amount |
|---|---|---|---|
| Previous Owner | Kern Ii William | $50,000 |
Source: Public Records
Tax History Compared to Growth
Tax History
| Year | Tax Paid | Tax Assessment Tax Assessment Total Assessment is a certain percentage of the fair market value that is determined by local assessors to be the total taxable value of land and additions on the property. | Land | Improvement |
|---|---|---|---|---|
| 2024 | $3,077 | $58,370 | $16,461 | $41,909 |
| 2023 | $3,165 | $58,370 | $16,461 | $41,909 |
| 2022 | $2,586 | $39,998 | $9,933 | $30,065 |
| 2021 | $2,454 | $39,998 | $9,933 | $30,065 |
| 2020 | $2,492 | $39,998 | $9,933 | $30,065 |
| 2019 | $2,279 | $34,188 | $8,491 | $25,697 |
| 2018 | $2,292 | $34,188 | $8,491 | $25,697 |
| 2017 | $2,174 | $34,188 | $8,491 | $25,697 |
| 2016 | $2,302 | $34,671 | $8,421 | $26,250 |
| 2015 | $2,327 | $34,671 | $8,421 | $26,250 |
| 2014 | $2,382 | $34,671 | $8,421 | $26,250 |
| 2013 | $2,024 | $32,102 | $7,798 | $24,304 |
Source: Public Records
Map
Nearby Homes