Estimated Value: $401,875 - $544,000
3
Beds
2
Baths
3,773
Sq Ft
$122/Sq Ft
Est. Value
About This Home
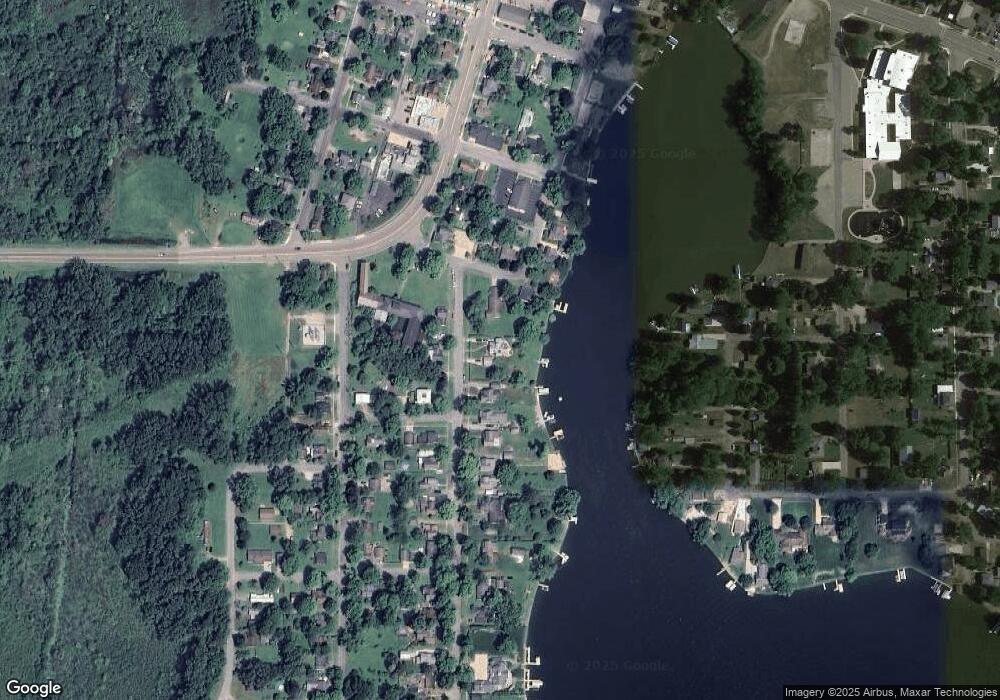
This home is located at 423 Maple St, Colon, MI 49040 and is currently estimated at $460,719, approximately $122 per square foot. 423 Maple St is a home located in St. Joseph County.
Ownership History
Date
Name
Owned For
Owner Type
Purchase Details
Closed on
Dec 14, 2011
Sold by
Dambra Deborah S and Dambra John Guy
Bought by
Bass Randal S
Current Estimated Value
Home Financials for this Owner
Home Financials are based on the most recent Mortgage that was taken out on this home.
Original Mortgage
$174,928
Outstanding Balance
$127,865
Interest Rate
5.5%
Mortgage Type
FHA
Estimated Equity
$332,854
Purchase Details
Closed on
Nov 11, 2004
Sold by
Dambra John Guy
Bought by
Dambra John Guy and Dambra Deborah S
Purchase Details
Closed on
Nov 30, 2001
Sold by
Dambra Jr John Guy and Dambra Deborah S
Purchase Details
Closed on
Jan 1, 1901
Create a Home Valuation Report for This Property
The Home Valuation Report is an in-depth analysis detailing your home's value as well as a comparison with similar homes in the area
Purchase History
| Date | Buyer | Sale Price | Title Company |
|---|---|---|---|
| Bass Randal S | $163,000 | Patrict Abstract And Title O | |
| Dambra John Guy | -- | -- | |
| -- | -- | -- | |
| -- | -- | -- |
Source: Public Records
Mortgage History
| Date | Status | Borrower | Loan Amount |
|---|---|---|---|
| Open | Bass Randal S | $174,928 |
Source: Public Records
Tax History Compared to Growth
Tax History
| Year | Tax Paid | Tax Assessment Tax Assessment Total Assessment is a certain percentage of the fair market value that is determined by local assessors to be the total taxable value of land and additions on the property. | Land | Improvement |
|---|---|---|---|---|
| 2025 | $4,118 | $204,300 | $90,300 | $114,000 |
| 2024 | $3,542 | $170,400 | $63,800 | $106,600 |
| 2023 | $3,861 | $154,100 | $63,800 | $90,300 |
| 2022 | $0 | $139,000 | $63,800 | $75,200 |
| 2021 | $3,298 | $133,200 | $63,800 | $69,400 |
| 2020 | $1,694 | $133,500 | $63,800 | $69,700 |
| 2019 | $1,296 | $123,800 | $63,800 | $60,000 |
| 2018 | $4,736 | $119,600 | $63,800 | $55,800 |
| 2017 | $4,587 | $120,200 | $120,200 | $0 |
| 2016 | -- | $121,700 | $121,700 | $0 |
| 2015 | -- | $119,200 | $0 | $0 |
| 2014 | -- | $115,500 | $115,500 | $0 |
| 2012 | -- | $117,800 | $117,800 | $0 |
Source: Public Records
Map
Nearby Homes
- 210 E South St
- 161 Palmer Ave
- 229 Palmer Ave
- VL Bowman St
- 917 Elm St
- 448 Long Lake Rd
- 0 S Farrand Unit 25051538
- 0 N Burr Oak Rd
- 32205 James St
- 31688 W Colon Rd
- 59178 Nora Dr
- 30725 Orla Engle Rd
- 60651 Bert Rd
- 55637 Bennett Rd
- 30315 Jacksonburg Rd
- VL Heights Dr
- 30879 Michigan 60
- 881 Brent Dr
- 31765 Michigan 60
- 0 Dunks Rd
