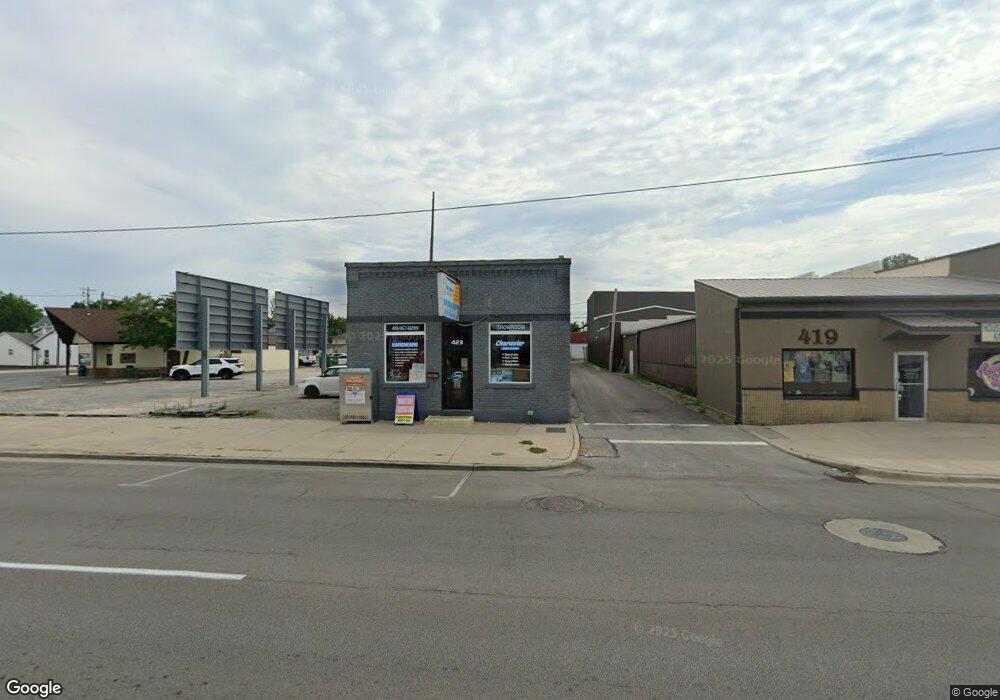
423 N Main St Findlay, OH 45840
Estimated Value: $189,067
Studio
--
Bath
6,554
Sq Ft
$29/Sq Ft
Est. Value
About This Home
This home is located at 423 N Main St, Findlay, OH 45840 and is currently estimated at $189,067, approximately $28 per square foot. 423 N Main St is a home located in Hancock County with nearby schools including Whittier Primary School, Bigelow Hill Elementary School, and Glenwood Middle School.
Ownership History
Date
Name
Owned For
Owner Type
Purchase Details
Closed on
Sep 8, 2023
Sold by
Fleck Pamela K and Wallace Karen S
Bought by
Clearwater Pool And Spa Llc
Current Estimated Value
Home Financials for this Owner
Home Financials are based on the most recent Mortgage that was taken out on this home.
Original Mortgage
$135,270
Outstanding Balance
$128,459
Interest Rate
6.81%
Mortgage Type
New Conventional
Estimated Equity
$60,608
Purchase Details
Closed on
Oct 10, 2019
Sold by
Estate Of Hugh Ferguson
Bought by
Ferguson Lily M
Purchase Details
Closed on
Jan 19, 1983
Bought by
Ferguson Hugh L and Ferguson Lily M
Create a Home Valuation Report for This Property
The Home Valuation Report is an in-depth analysis detailing your home's value as well as a comparison with similar homes in the area
Home Values in the Area
Average Home Value in this Area
Purchase History
| Date | Buyer | Sale Price | Title Company |
|---|---|---|---|
| Clearwater Pool And Spa Llc | -- | Flag City Title | |
| Ferguson Lily M | -- | None Available | |
| Ferguson Hugh L | $41,600 | -- |
Source: Public Records
Mortgage History
| Date | Status | Borrower | Loan Amount |
|---|---|---|---|
| Open | Clearwater Pool And Spa Llc | $135,270 |
Source: Public Records
Tax History
| Year | Tax Paid | Tax Assessment Tax Assessment Total Assessment is a certain percentage of the fair market value that is determined by local assessors to be the total taxable value of land and additions on the property. | Land | Improvement |
|---|---|---|---|---|
| 2024 | $1,669 | $28,510 | $16,610 | $11,900 |
| 2023 | $1,601 | $28,510 | $16,610 | $11,900 |
| 2022 | $1,592 | $28,510 | $16,610 | $11,900 |
| 2021 | $1,564 | $24,240 | $9,490 | $14,750 |
| 2020 | $1,566 | $24,240 | $9,490 | $14,750 |
| 2019 | $1,575 | $24,240 | $9,490 | $14,750 |
| 2018 | $1,590 | $24,240 | $9,490 | $14,750 |
| 2017 | $795 | $24,240 | $9,490 | $14,750 |
| 2016 | $1,607 | $24,240 | $9,490 | $14,750 |
| 2015 | $1,425 | $22,010 | $4,800 | $17,210 |
| 2014 | $1,430 | $22,010 | $4,800 | $17,210 |
| 2012 | $1,437 | $22,010 | $4,800 | $17,210 |
Source: Public Records
Map
Nearby Homes
- 125 Cherry St
- 213 Cherry St
- 207 Ash Ave
- 341 Defiance Ave
- 407 Washington St
- 523 Center St
- 608 W Front St
- 640 Center St
- 206 Midland Ave
- 322 Midland Ave
- 301 Allen Ave
- 655 Clinton Ct
- 514 Liberty St
- 810 Mcconnell St
- 807 W Main Cross St
- 741 Central Ave
- 527 W Sandusky St
- 439 Carnahan Ave
- 605 Davis St
- 623 E Sandusky St
- 433 N Main St
- 123 Walnut St
- 110 Walnut St
- Lot 2 N Main
- Lot 3 N Main
- 420 N Main St
- 430 S Main St
- 420 Clinton St
- 116 Walnut St Unit A
- 116 Walnut St Unit D
- 116 Walnut St Unit B
- 418 Clinton St
- 424 Clinton St
- 424 N Main St
- 416 N Main St
- 428 Clinton St
- 507 N Main St
- 428 N Main St
- 500 N Main St
- 432 N Main St
Your Personal Tour Guide
Ask me questions while you tour the home.