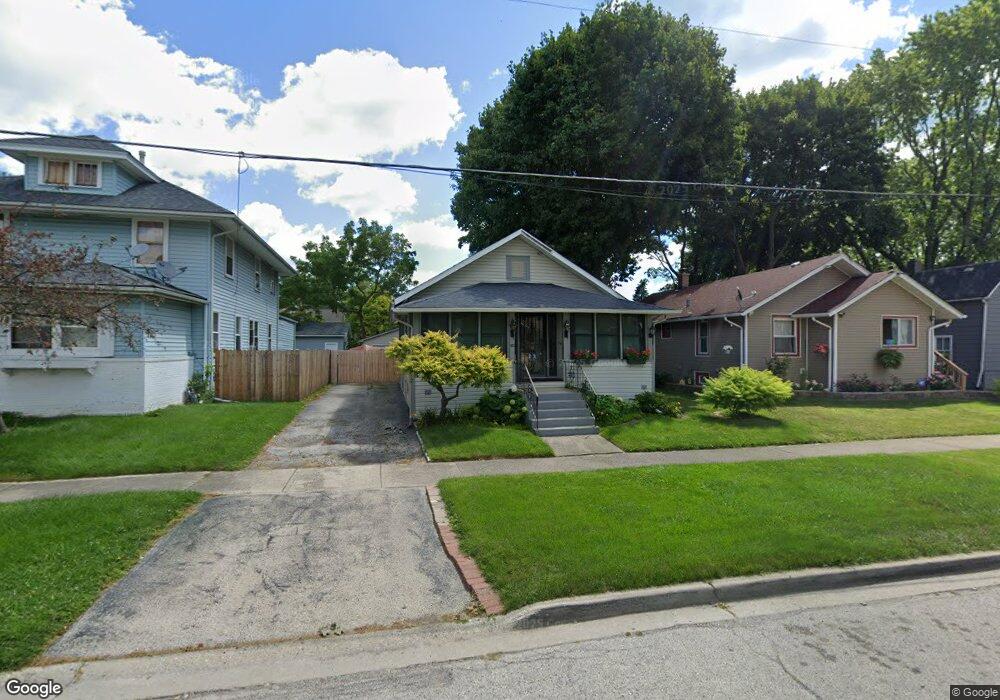
423 N Poplar St Waukegan, IL 60085
Estimated Value: $159,000 - $181,000
2
Beds
1
Bath
672
Sq Ft
$256/Sq Ft
Est. Value
About This Home
This home is located at 423 N Poplar St, Waukegan, IL 60085 and is currently estimated at $172,260, approximately $256 per square foot. 423 N Poplar St is a home located in Lake County with nearby schools including Glen Flora Elementary School, Edith M Smith Middle School, and Waukegan High School.
Ownership History
Date
Name
Owned For
Owner Type
Purchase Details
Closed on
Jul 15, 2013
Sold by
Gonzalez Franklin J and Gonzalez Elia
Bought by
Gonzalez Franklin J
Current Estimated Value
Purchase Details
Closed on
Jun 28, 2001
Sold by
Schwalm Walter and Walter Schwalm Trust
Bought by
Gonzalez Franklin J and Gonzalez Elia
Home Financials for this Owner
Home Financials are based on the most recent Mortgage that was taken out on this home.
Original Mortgage
$81,200
Outstanding Balance
$31,292
Interest Rate
7.14%
Estimated Equity
$140,968
Purchase Details
Closed on
Apr 19, 2001
Sold by
Schwalm Walter
Bought by
Schwalm Walter and Walter Schwalm Trust
Create a Home Valuation Report for This Property
The Home Valuation Report is an in-depth analysis detailing your home's value as well as a comparison with similar homes in the area
Home Values in the Area
Average Home Value in this Area
Purchase History
| Date | Buyer | Sale Price | Title Company |
|---|---|---|---|
| Gonzalez Franklin J | -- | None Available | |
| Gonzalez Franklin J | $82,500 | -- | |
| Schwalm Walter | -- | -- |
Source: Public Records
Mortgage History
| Date | Status | Borrower | Loan Amount |
|---|---|---|---|
| Open | Gonzalez Franklin J | $81,200 |
Source: Public Records
Tax History Compared to Growth
Tax History
| Year | Tax Paid | Tax Assessment Tax Assessment Total Assessment is a certain percentage of the fair market value that is determined by local assessors to be the total taxable value of land and additions on the property. | Land | Improvement |
|---|---|---|---|---|
| 2024 | $567 | $41,805 | $7,583 | $34,222 |
| 2023 | $1,076 | $37,428 | $6,789 | $30,639 |
| 2022 | $1,076 | $33,806 | $6,457 | $27,349 |
| 2021 | $1,148 | $29,222 | $5,761 | $23,461 |
| 2020 | $1,248 | $27,224 | $5,367 | $21,857 |
| 2019 | $1,353 | $24,946 | $4,918 | $20,028 |
| 2018 | $1,869 | $24,879 | $6,264 | $18,615 |
| 2017 | $2,278 | $22,011 | $5,542 | $16,469 |
| 2016 | $2,029 | $19,127 | $4,816 | $14,311 |
| 2015 | $1,878 | $17,119 | $4,310 | $12,809 |
| 2014 | $1,379 | $13,689 | $3,450 | $10,239 |
| 2012 | $2,195 | $14,831 | $3,738 | $11,093 |
Source: Public Records
Map
Nearby Homes
- 428 N Poplar St
- 511 Chestnut St
- 522 N Poplar St
- 702 Franklin St
- 620 N Poplar St
- 452 North Ave
- 325 4th St
- 918 N Ash St
- 509 N Butrick St
- 222 Grand Ave
- 28 N Saint James St
- 723 N County St
- 611 N Genesee St
- 1109 Massena Ave
- 917 N Linden Ave
- 415 W Ridgeland Ave
- 23 N Jackson St
- 613 Washington St
- 824 N Butrick St
- 1110 N Ash St