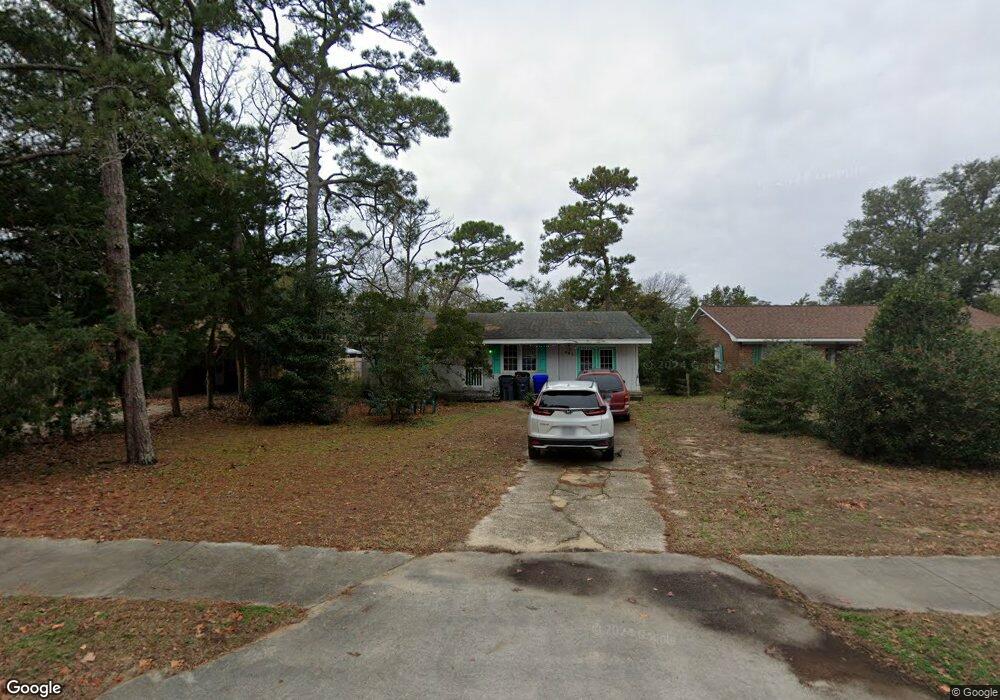
423 Norton St Oak Island, NC 28465
Estimated Value: $384,514 - $561,000
3
Beds
2
Baths
1,201
Sq Ft
$395/Sq Ft
Est. Value
About This Home
This home is located at 423 Norton St, Oak Island, NC 28465 and is currently estimated at $474,129, approximately $394 per square foot. 423 Norton St is a home located in Brunswick County with nearby schools including Southport Elementary School, South Brunswick Middle School, and South Brunswick High School.
Ownership History
Date
Name
Owned For
Owner Type
Purchase Details
Closed on
Mar 4, 2005
Sold by
Kelly William and Kelly Patricia
Bought by
Price Mary P
Current Estimated Value
Home Financials for this Owner
Home Financials are based on the most recent Mortgage that was taken out on this home.
Original Mortgage
$113,400
Outstanding Balance
$60,360
Interest Rate
6.37%
Mortgage Type
Adjustable Rate Mortgage/ARM
Estimated Equity
$413,769
Create a Home Valuation Report for This Property
The Home Valuation Report is an in-depth analysis detailing your home's value as well as a comparison with similar homes in the area
Home Values in the Area
Average Home Value in this Area
Purchase History
| Date | Buyer | Sale Price | Title Company |
|---|---|---|---|
| Price Mary P | $126,000 | None Available |
Source: Public Records
Mortgage History
| Date | Status | Borrower | Loan Amount |
|---|---|---|---|
| Open | Price Mary P | $113,400 |
Source: Public Records
Tax History Compared to Growth
Tax History
| Year | Tax Paid | Tax Assessment Tax Assessment Total Assessment is a certain percentage of the fair market value that is determined by local assessors to be the total taxable value of land and additions on the property. | Land | Improvement |
|---|---|---|---|---|
| 2025 | $1,298 | $287,380 | $130,000 | $157,380 |
| 2024 | $1,298 | $287,380 | $130,000 | $157,380 |
| 2023 | $958 | $287,380 | $130,000 | $157,380 |
| 2022 | $958 | $148,280 | $65,000 | $83,280 |
| 2021 | $928 | $148,280 | $65,000 | $83,280 |
| 2020 | $903 | $148,280 | $65,000 | $83,280 |
| 2019 | $903 | $65,600 | $65,000 | $600 |
| 2018 | $776 | $40,600 | $40,000 | $600 |
| 2017 | $776 | $40,600 | $40,000 | $600 |
| 2016 | $751 | $40,600 | $40,000 | $600 |
| 2015 | $751 | $124,060 | $40,000 | $84,060 |
| 2014 | $797 | $144,410 | $75,000 | $69,410 |
Source: Public Records
Map
Nearby Homes