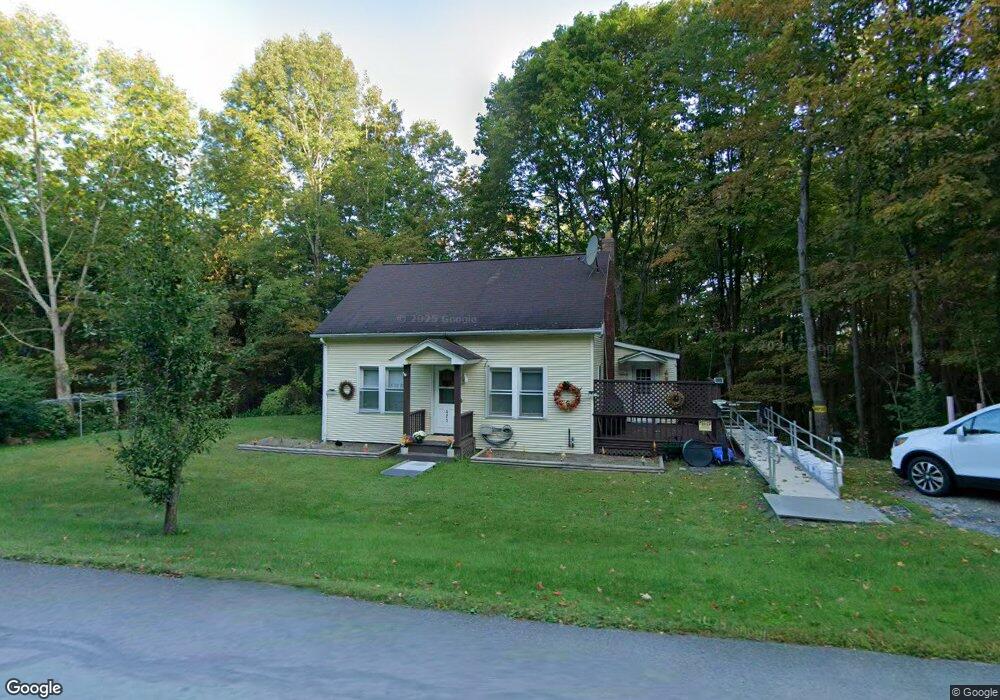
423 Pattison Rd North Adams, MA 01247
Estimated Value: $250,780 - $299,000
3
Beds
1
Bath
1,152
Sq Ft
$238/Sq Ft
Est. Value
About This Home
This home is located at 423 Pattison Rd, North Adams, MA 01247 and is currently estimated at $274,593, approximately $238 per square foot. 423 Pattison Rd is a home located in Berkshire County with nearby schools including Brayton Elementary School and Drury High School.
Ownership History
Date
Name
Owned For
Owner Type
Purchase Details
Closed on
Aug 29, 2008
Sold by
Gauthier-Boucher Donna M
Bought by
Mowe Kathleen M and Mowe Lawrence J
Current Estimated Value
Purchase Details
Closed on
Nov 13, 1991
Sold by
Alfonso Larry L
Bought by
New Bk Of New England
Create a Home Valuation Report for This Property
The Home Valuation Report is an in-depth analysis detailing your home's value as well as a comparison with similar homes in the area
Home Values in the Area
Average Home Value in this Area
Purchase History
| Date | Buyer | Sale Price | Title Company |
|---|---|---|---|
| Mowe Kathleen M | $117,500 | -- | |
| New Bk Of New England | $98,000 | -- | |
| Mowe Kathleen M | $117,500 | -- | |
| New Bk Of New England | $98,000 | -- |
Source: Public Records
Mortgage History
| Date | Status | Borrower | Loan Amount |
|---|---|---|---|
| Previous Owner | New Bk Of New England | $100,000 | |
| Previous Owner | New Bk Of New England | $94,778 | |
| Previous Owner | New Bk Of New England | $25,000 |
Source: Public Records
Tax History Compared to Growth
Tax History
| Year | Tax Paid | Tax Assessment Tax Assessment Total Assessment is a certain percentage of the fair market value that is determined by local assessors to be the total taxable value of land and additions on the property. | Land | Improvement |
|---|---|---|---|---|
| 2025 | $3,676 | $220,000 | $44,800 | $175,200 |
| 2024 | $3,450 | $201,300 | $41,000 | $160,300 |
| 2023 | $3,331 | $188,500 | $41,000 | $147,500 |
| 2022 | $3,037 | $163,900 | $41,000 | $122,900 |
| 2021 | $2,825 | $151,800 | $38,000 | $113,800 |
| 2020 | $2,640 | $141,800 | $37,700 | $104,100 |
| 2019 | $2,480 | $129,800 | $34,800 | $95,000 |
| 2018 | $2,386 | $129,800 | $36,600 | $93,200 |
| 2017 | $2,272 | $128,600 | $36,300 | $92,300 |
| 2016 | $2,205 | $126,800 | $36,300 | $90,500 |
| 2015 | $2,116 | $126,800 | $36,300 | $90,500 |
Source: Public Records
Map
Nearby Homes