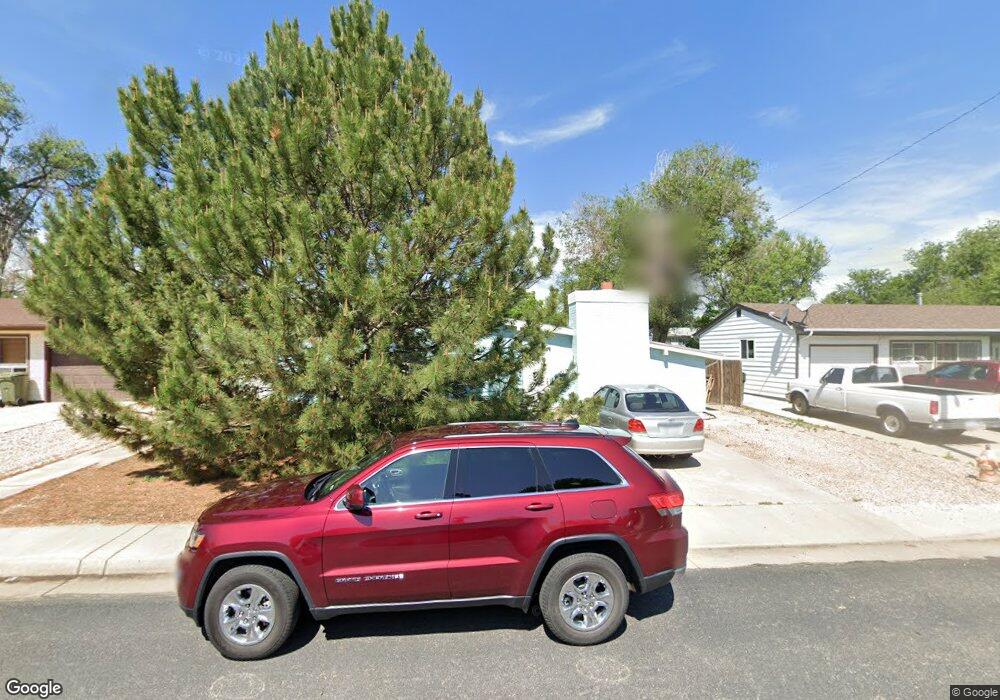
423 Pine St Fort Morgan, CO 80701
Estimated Value: $254,122 - $309,000
3
Beds
1
Bath
1,740
Sq Ft
$159/Sq Ft
Est. Value
About This Home
This home is located at 423 Pine St, Fort Morgan, CO 80701 and is currently estimated at $276,531, approximately $158 per square foot. 423 Pine St is a home located in Morgan County with nearby schools including Fort Morgan High School and Lighthouse Seventh-day Adventist Christian School.
Ownership History
Date
Name
Owned For
Owner Type
Purchase Details
Closed on
Apr 10, 2007
Sold by
Jp Morgan Chase Bank
Bought by
Wiese Paul D and Wiese Kelly O
Current Estimated Value
Home Financials for this Owner
Home Financials are based on the most recent Mortgage that was taken out on this home.
Original Mortgage
$74,955
Outstanding Balance
$45,345
Interest Rate
6.16%
Mortgage Type
New Conventional
Estimated Equity
$231,186
Purchase Details
Closed on
Oct 10, 2006
Sold by
Lara Salvador and Lara Carmen M
Bought by
Jpmorgan Chase Bank
Create a Home Valuation Report for This Property
The Home Valuation Report is an in-depth analysis detailing your home's value as well as a comparison with similar homes in the area
Purchase History
| Date | Buyer | Sale Price | Title Company |
|---|---|---|---|
| Wiese Paul D | $78,900 | None Available | |
| Jpmorgan Chase Bank | $50,000 | None Available |
Source: Public Records
Mortgage History
| Date | Status | Borrower | Loan Amount |
|---|---|---|---|
| Open | Wiese Paul D | $74,955 |
Source: Public Records
Tax History
| Year | Tax Paid | Tax Assessment Tax Assessment Total Assessment is a certain percentage of the fair market value that is determined by local assessors to be the total taxable value of land and additions on the property. | Land | Improvement |
|---|---|---|---|---|
| 2024 | $1,428 | $13,720 | $2,120 | $11,600 |
| 2023 | $1,099 | $17,390 | $2,680 | $14,710 |
| 2022 | $1,055 | $12,870 | $2,630 | $10,240 |
| 2021 | $1,086 | $13,230 | $2,700 | $10,530 |
| 2020 | $1,038 | $12,310 | $2,570 | $9,740 |
| 2019 | $1,040 | $12,310 | $2,570 | $9,740 |
| 2018 | $781 | $9,110 | $2,140 | $6,970 |
| 2017 | $782 | $9,110 | $2,140 | $6,970 |
| 2016 | $757 | $8,740 | $2,580 | $6,160 |
| 2015 | $746 | $8,740 | $2,580 | $6,160 |
| 2014 | $790 | $9,030 | $2,290 | $6,740 |
| 2013 | -- | $9,030 | $2,290 | $6,740 |
Source: Public Records
Map
Nearby Homes
Your Personal Tour Guide
Ask me questions while you tour the home.