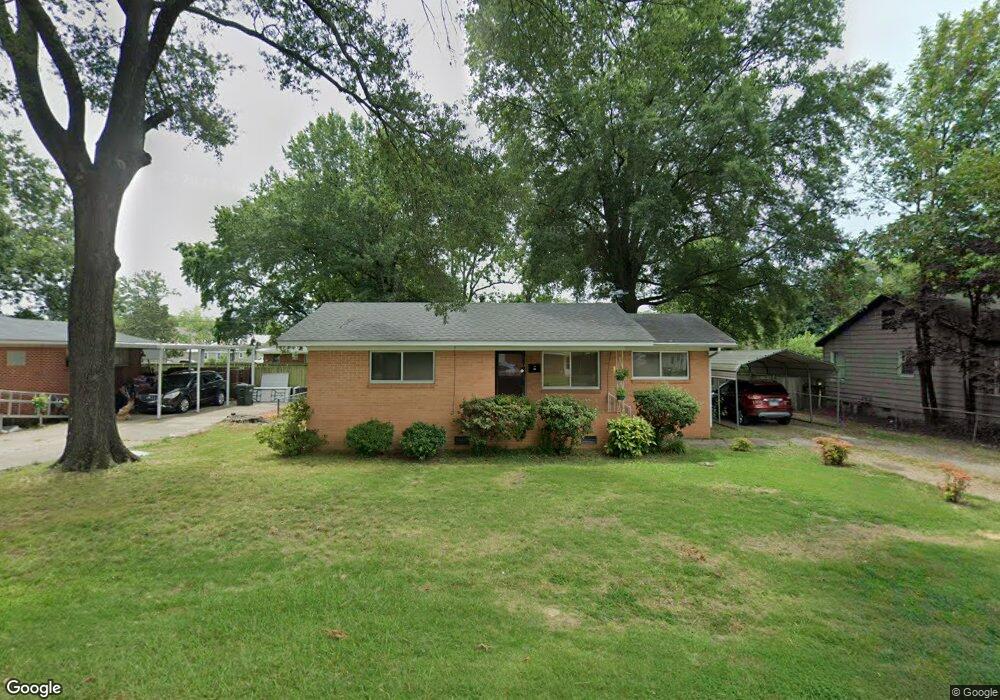
423 Polk St Conway, AR 72032
East Conway NeighborhoodEstimated Value: $117,000 - $141,000
2
Beds
1
Bath
950
Sq Ft
$132/Sq Ft
Est. Value
About This Home
This home is located at 423 Polk St, Conway, AR 72032 and is currently estimated at $125,439, approximately $132 per square foot. 423 Polk St is a home located in Faulkner County with nearby schools including Marguerite Vann Elementary School, Conway Junior High School, and Carl Stuart Middle School.
Ownership History
Date
Name
Owned For
Owner Type
Purchase Details
Closed on
May 26, 2021
Sold by
Morehead Jeremy and Morehead Jennifer N
Bought by
Jennifer N Morehead Residential Trust
Current Estimated Value
Purchase Details
Closed on
May 25, 2021
Sold by
Collins Francis A
Bought by
Morehead Jennifer N
Purchase Details
Closed on
May 3, 2010
Sold by
Mayor Robert J
Bought by
Collins Francis Anthony
Home Financials for this Owner
Home Financials are based on the most recent Mortgage that was taken out on this home.
Original Mortgage
$67,929
Interest Rate
4.93%
Mortgage Type
VA
Purchase Details
Closed on
Jan 24, 1989
Bought by
Qc
Create a Home Valuation Report for This Property
The Home Valuation Report is an in-depth analysis detailing your home's value as well as a comparison with similar homes in the area
Home Values in the Area
Average Home Value in this Area
Purchase History
| Date | Buyer | Sale Price | Title Company |
|---|---|---|---|
| Jennifer N Morehead Residential Trust | -- | None Listed On Document | |
| Morehead Jennifer N | -- | None Listed On Document | |
| Collins Francis Anthony | $67,000 | -- | |
| Qc | -- | -- |
Source: Public Records
Mortgage History
| Date | Status | Borrower | Loan Amount |
|---|---|---|---|
| Previous Owner | Collins Francis Anthony | $67,929 |
Source: Public Records
Tax History Compared to Growth
Tax History
| Year | Tax Paid | Tax Assessment Tax Assessment Total Assessment is a certain percentage of the fair market value that is determined by local assessors to be the total taxable value of land and additions on the property. | Land | Improvement |
|---|---|---|---|---|
| 2025 | $613 | $18,200 | $3,400 | $14,800 |
| 2024 | $613 | $18,200 | $3,400 | $14,800 |
| 2023 | $613 | $13,570 | $3,400 | $10,170 |
| 2022 | $238 | $13,570 | $3,400 | $10,170 |
| 2021 | $238 | $13,570 | $3,400 | $10,170 |
| 2020 | $208 | $11,530 | $3,400 | $8,130 |
| 2019 | $208 | $11,530 | $3,400 | $8,130 |
| 2018 | $233 | $11,530 | $3,400 | $8,130 |
| 2017 | $233 | $11,530 | $3,400 | $8,130 |
| 2016 | $226 | $11,390 | $3,400 | $7,990 |
| 2015 | $549 | $10,850 | $3,400 | $7,450 |
| 2014 | $199 | $10,850 | $3,400 | $7,450 |
Source: Public Records
Map
Nearby Homes