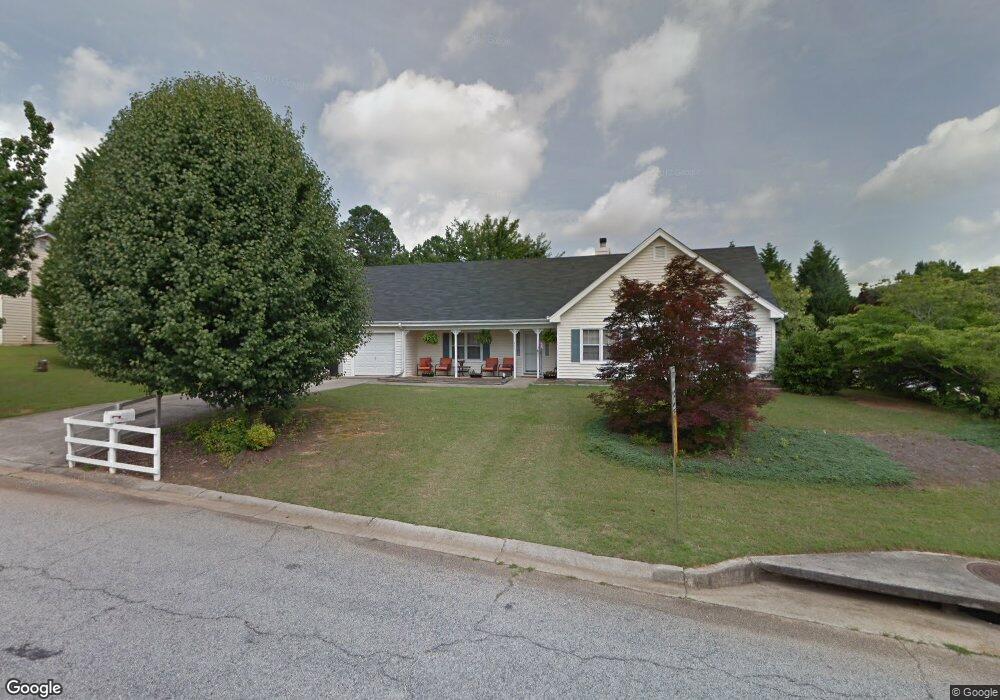
423 Rhett Dr Unit 3 Loganville, GA 30052
Estimated Value: $316,000 - $340,000
3
Beds
2
Baths
1,720
Sq Ft
$190/Sq Ft
Est. Value
About This Home
This home is located at 423 Rhett Dr Unit 3, Loganville, GA 30052 and is currently estimated at $327,339, approximately $190 per square foot. 423 Rhett Dr Unit 3 is a home located in Gwinnett County with nearby schools including Magill Elementary School, Grace Snell Middle School, and South Gwinnett High School.
Ownership History
Date
Name
Owned For
Owner Type
Purchase Details
Closed on
Sep 6, 2022
Sold by
Cooper William Larry
Bought by
Resicap Georgia Owner Iii Llc
Current Estimated Value
Purchase Details
Closed on
Mar 31, 2000
Sold by
Perrin Frank D and Perrin Pamela L
Bought by
Cooper William L and Cooper Jacqueline W
Home Financials for this Owner
Home Financials are based on the most recent Mortgage that was taken out on this home.
Original Mortgage
$113,037
Interest Rate
8.29%
Mortgage Type
New Conventional
Purchase Details
Closed on
Feb 2, 1996
Sold by
Lacoss Claire Everett
Bought by
Fulford Frank
Purchase Details
Closed on
May 31, 1994
Sold by
Black Keith A Marla
Bought by
Lacoss Claire H
Home Financials for this Owner
Home Financials are based on the most recent Mortgage that was taken out on this home.
Original Mortgage
$70,800
Interest Rate
8.51%
Create a Home Valuation Report for This Property
The Home Valuation Report is an in-depth analysis detailing your home's value as well as a comparison with similar homes in the area
Home Values in the Area
Average Home Value in this Area
Purchase History
| Date | Buyer | Sale Price | Title Company |
|---|---|---|---|
| Resicap Georgia Owner Iii Llc | $294,000 | -- | |
| Cooper William L | $114,000 | -- | |
| Fulford Frank | $93,000 | -- | |
| Lacoss Claire H | $88,500 | -- |
Source: Public Records
Mortgage History
| Date | Status | Borrower | Loan Amount |
|---|---|---|---|
| Previous Owner | Cooper William L | $113,037 | |
| Previous Owner | Lacoss Claire H | $70,800 | |
| Closed | Fulford Frank | $0 |
Source: Public Records
Tax History Compared to Growth
Tax History
| Year | Tax Paid | Tax Assessment Tax Assessment Total Assessment is a certain percentage of the fair market value that is determined by local assessors to be the total taxable value of land and additions on the property. | Land | Improvement |
|---|---|---|---|---|
| 2024 | $3,436 | $119,320 | $18,000 | $101,320 |
| 2023 | $3,436 | $117,600 | $27,080 | $90,520 |
| 2022 | $2,123 | $96,360 | $20,000 | $76,360 |
| 2021 | $1,762 | $76,360 | $15,200 | $61,160 |
| 2020 | $1,660 | $70,760 | $14,000 | $56,760 |
| 2019 | $1,419 | $59,720 | $11,200 | $48,520 |
| 2018 | $1,428 | $59,720 | $11,200 | $48,520 |
| 2016 | $1,174 | $47,920 | $8,000 | $39,920 |
| 2015 | $1,085 | $43,280 | $8,000 | $35,280 |
| 2014 | -- | $43,280 | $8,000 | $35,280 |
Source: Public Records
Map
Nearby Homes
- 433 Rhett Dr
- 716 Wilkes Dr
- 443 Rhett Dr
- 737 Wilkes Dr
- 256 Teresa Ln
- 4441 Fiddlers Bend Unit 4
- 241 Fox Run
- 89 Alameda St
- 89 Alameda St Unit 12
- 922 Lakeside Ct
- 910 Lakeside Ct
- 3825 Oak Grove Rd SW
- 3810 Weeping Willow Ln
- 4085 Hogans Mill Ln
- 3865 Weeping Willow Ln
- 571 Bradford Place Ct
- 504 Bradford Park Ct Unit 6
- 110 Slate Ridge Ln
- 719 Wilkes Dr
- 724 Wilkes Dr Unit 3
- 720 Wilkes Dr
- 424 Rhett Dr
- 434 Rhett Dr
- 420 Ashley Way
- 443 Rhett Dr Unit 1
- 443 Rhett Dr Unit 3
- 730 Wilkes Dr
- 410 Ashley Way
- 430 Ashley Way Unit II
- 430 Ashley Way
- 444 Rhett Dr Unit 3
- 712 Wilkes Dr Unit 2
- 734 Wilkes Dr
- 453 Rhett Dr
- 708 Wilkes Dr
- 454 Rhett Dr
- 738 Wilkes Dr Unit 4
- 0 Rhett Dr Unit 7122848