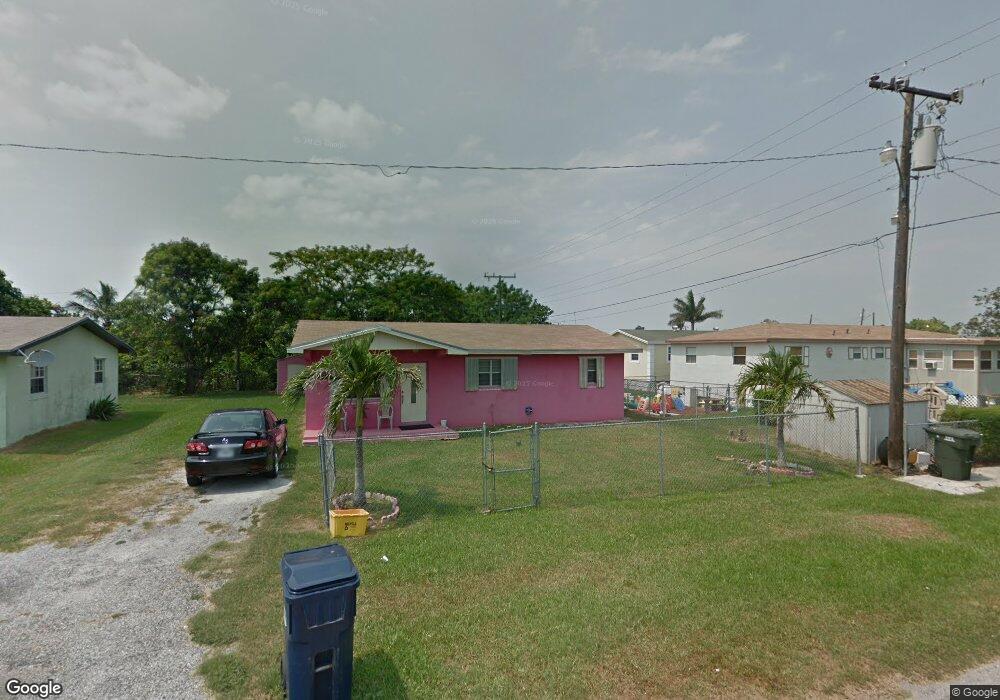
423 Sago Ct Pahokee, FL 33476
Estimated Value: $132,000 - $295,808
Studio
2
Baths
1,000
Sq Ft
$197/Sq Ft
Est. Value
About This Home
This home is located at 423 Sago Ct, Pahokee, FL 33476 and is currently estimated at $197,452, approximately $197 per square foot. 423 Sago Ct is a home located in Palm Beach County with nearby schools including Pahokee Elementary School, Pahokee Middle/Senior High School, and Glades Academy Elementary School.
Ownership History
Date
Name
Owned For
Owner Type
Purchase Details
Closed on
Oct 15, 2019
Sold by
Lee Gwendolyn
Bought by
Lee Arlie
Current Estimated Value
Purchase Details
Closed on
May 5, 2004
Sold by
Lee Arlie and Lee Gwendolyn
Bought by
Lee Gwendolyn
Purchase Details
Closed on
Feb 2, 2004
Sold by
Lee Arlie and Lee Gwendolyn
Bought by
Lee Gwendolyn
Purchase Details
Closed on
Jun 6, 1996
Sold by
Thompson Curtis A and Thompson Jane M
Bought by
Lee Arlie and Lee Gwendolyn
Home Financials for this Owner
Home Financials are based on the most recent Mortgage that was taken out on this home.
Original Mortgage
$45,600
Outstanding Balance
$1,940
Interest Rate
7.88%
Mortgage Type
New Conventional
Estimated Equity
$195,512
Purchase Details
Closed on
Mar 31, 1995
Sold by
Ca Fed Bk F S B
Bought by
Thompson Curits A and Thompson Jane M
Purchase Details
Closed on
Mar 23, 1995
Sold by
Resolution Tr Corp
Bought by
Ca Federal Bk
Create a Home Valuation Report for This Property
The Home Valuation Report is an in-depth analysis detailing your home's value as well as a comparison with similar homes in the area
Home Values in the Area
Average Home Value in this Area
Purchase History
| Date | Buyer | Sale Price | Title Company |
|---|---|---|---|
| Lee Arlie | $27,000 | None Available | |
| Lee Gwendolyn | -- | -- | |
| Lee Gwendolyn | -- | -- | |
| Lee Arlie | $48,000 | -- | |
| Thompson Curits A | $20,000 | -- | |
| Ca Federal Bk | -- | -- |
Source: Public Records
Mortgage History
| Date | Status | Borrower | Loan Amount |
|---|---|---|---|
| Open | Lee Arlie | $45,600 |
Source: Public Records
Tax History
| Year | Tax Paid | Tax Assessment Tax Assessment Total Assessment is a certain percentage of the fair market value that is determined by local assessors to be the total taxable value of land and additions on the property. | Land | Improvement |
|---|---|---|---|---|
| 2025 | $2,954 | $118,084 | -- | -- |
| 2024 | $2,954 | $107,349 | -- | -- |
| 2023 | $2,504 | $97,590 | $0 | $0 |
| 2022 | $2,341 | $88,718 | $0 | $0 |
| 2021 | $2,136 | $80,653 | $13,260 | $67,393 |
| 2020 | $2,021 | $75,488 | $13,000 | $62,488 |
| 2019 | $1,658 | $63,942 | $13,000 | $50,942 |
| 2018 | $1,500 | $58,923 | $12,598 | $46,325 |
| 2017 | $1,356 | $48,014 | $10,954 | $37,060 |
| 2016 | $1,308 | $45,187 | $0 | $0 |
| 2015 | $1,336 | $45,187 | $0 | $0 |
| 2014 | $1,284 | $42,646 | $0 | $0 |
Source: Public Records
Map
Nearby Homes
- 0 W Martin Luther King jr Blvd Unit R10990459
- 0 Rardin Ave
- 1221 Bacom Point Rd
- * S Lake Ave
- 636 S Lake Ave
- 297 E 4th St
- 263 Carissa Dr
- 00 Bacom Point Rd
- 176 Bacom Point Rd
- 334 S Barfield Hwy
- 197 W Main St
- 170 Apple Ave
- 2316 Bacom Point Rd
- 2271 Bacom Point Rd
- 700 Larrimore Rd
- 1450 Muck City Rd
- 875 Joe Louis Ave
- 1697 E Main St
- 501 W Baines Terrace
- 12537 Lakeshore Dr
- 429 Sago Ct
- 740 Palm Blvd
- 730 Palm Blvd
- 424 N Cocoanut Rd
- 720 Palm Blvd
- 430 N Cocoanut Rd
- 435 Sago Ct
- 700 Palm Blvd
- 424 Sago Ct
- 750 Palm Blvd
- 430 Sago Ct
- 436 N Cocoanut Rd
- 441 Sago Ct
- 760 Palm Blvd
- 436 Sago Ct
- 760 Rickey Jackson Blvd
- 442 N Cocoanut Rd
- 739 Palm Blvd
- 745 Palm Blvd
- 745 Rickey Jackson Blvd
Your Personal Tour Guide
Ask me questions while you tour the home.