Estimated Value: $946,557
--
Bed
--
Bath
700
Sq Ft
$1,352/Sq Ft
Est. Value
About This Home
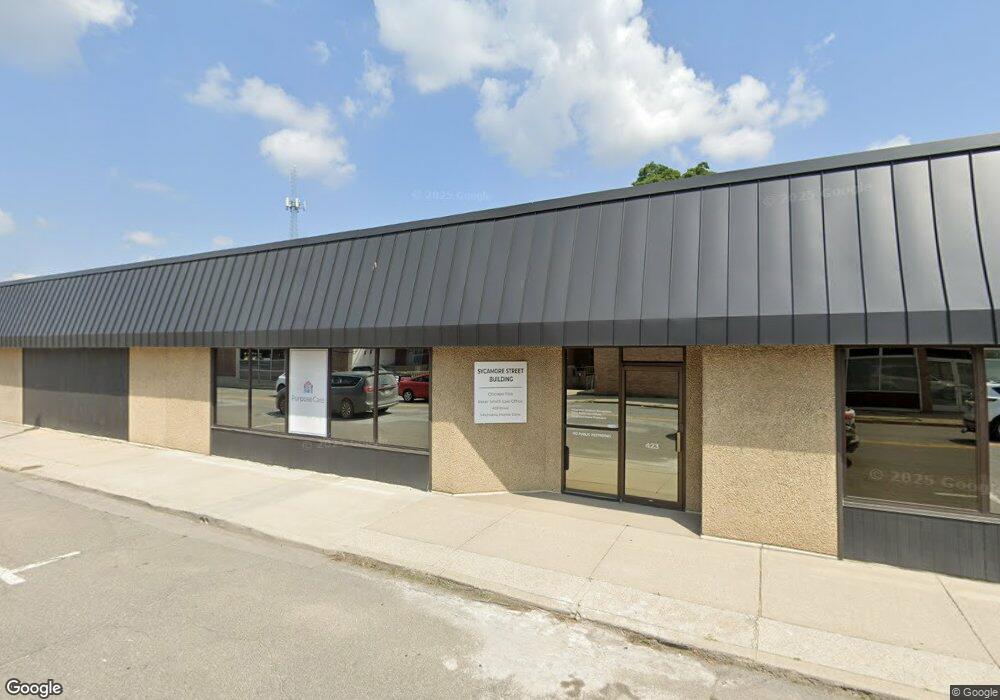
This home is located at 423 Sycamore St Unit STE 103, Niles, MI 49120 and is currently estimated at $946,557, approximately $1,352 per square foot. 423 Sycamore St Unit STE 103 is a home located in Berrien County with nearby schools including Ballard Elementary School, Oak Manor Sixth Grade Center, and Ring Lardner Middle School.
Ownership History
Date
Name
Owned For
Owner Type
Purchase Details
Closed on
Jan 1, 2022
Sold by
Roger Tracey Enterprises Llc
Bought by
Zm Properties Llc
Current Estimated Value
Purchase Details
Closed on
May 12, 2016
Sold by
Tracey Roger D and Tracey Roger
Bought by
Roger Tracey Enterprises Llc
Purchase Details
Closed on
Apr 16, 2005
Sold by
Gaynor Gary G and Gaynor Marjorie R
Bought by
Tracey Roger
Home Financials for this Owner
Home Financials are based on the most recent Mortgage that was taken out on this home.
Original Mortgage
$350,000
Interest Rate
6.06%
Mortgage Type
Commercial
Purchase Details
Closed on
Aug 1, 1979
Create a Home Valuation Report for This Property
The Home Valuation Report is an in-depth analysis detailing your home's value as well as a comparison with similar homes in the area
Home Values in the Area
Average Home Value in this Area
Purchase History
| Date | Buyer | Sale Price | Title Company |
|---|---|---|---|
| Zm Properties Llc | -- | Landgraf William R | |
| Roger Tracey Enterprises Llc | -- | None Available | |
| Tracey Roger | $400,000 | Chicago Title Of Mi Inc | |
| -- | -- | -- |
Source: Public Records
Mortgage History
| Date | Status | Borrower | Loan Amount |
|---|---|---|---|
| Previous Owner | Tracey Roger | $350,000 |
Source: Public Records
Tax History Compared to Growth
Tax History
| Year | Tax Paid | Tax Assessment Tax Assessment Total Assessment is a certain percentage of the fair market value that is determined by local assessors to be the total taxable value of land and additions on the property. | Land | Improvement |
|---|---|---|---|---|
| 2025 | $4,827 | $131,600 | $0 | $0 |
| 2024 | $2,588 | $128,100 | $0 | $0 |
| 2023 | $2,481 | $116,300 | $0 | $0 |
| 2022 | $2,363 | $97,500 | $0 | $0 |
| 2021 | $4,262 | $96,300 | $14,900 | $81,400 |
| 2020 | $4,211 | $98,800 | $0 | $0 |
| 2019 | $4,150 | $92,000 | $16,000 | $76,000 |
| 2018 | $4,054 | $92,000 | $0 | $0 |
| 2017 | $3,953 | $93,000 | $0 | $0 |
| 2016 | $3,884 | $95,000 | $0 | $0 |
| 2015 | $3,872 | $69,800 | $0 | $0 |
| 2014 | $2,302 | $83,000 | $0 | $0 |
Source: Public Records
Map
Nearby Homes