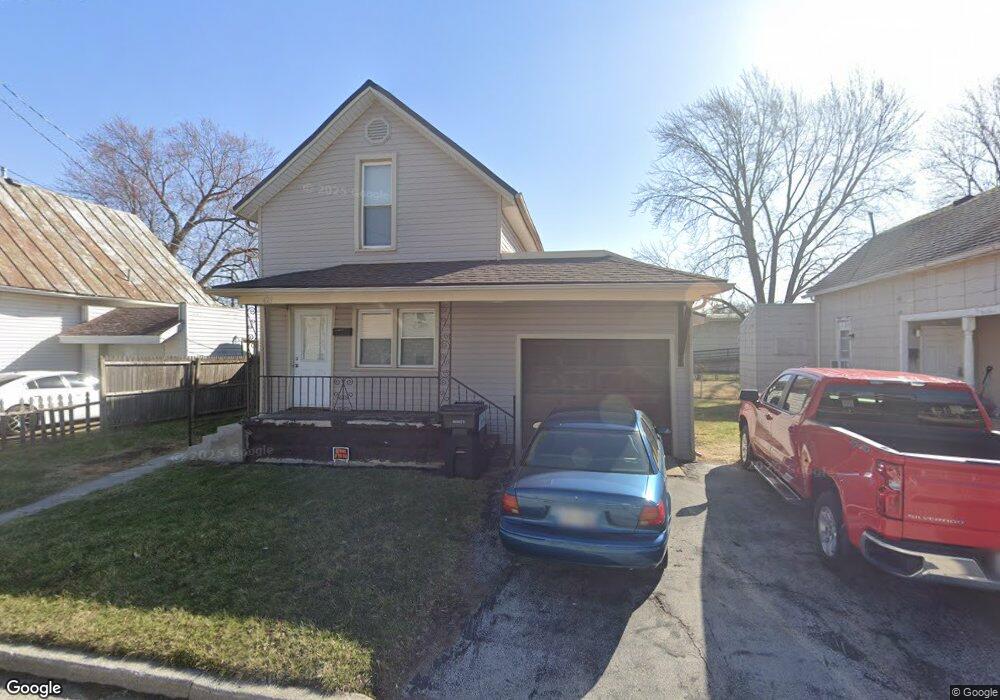
423 Taylor St Findlay, OH 45840
Estimated Value: $89,000 - $98,000
2
Beds
1
Bath
925
Sq Ft
$100/Sq Ft
Est. Value
About This Home
This home is located at 423 Taylor St, Findlay, OH 45840 and is currently estimated at $92,385, approximately $99 per square foot. 423 Taylor St is a home located in Hancock County with nearby schools including Whittier Primary School, Bigelow Hill Elementary School, and Glenwood Middle School.
Ownership History
Date
Name
Owned For
Owner Type
Purchase Details
Closed on
Sep 20, 2016
Bought by
Miguel A Flores
Current Estimated Value
Home Financials for this Owner
Home Financials are based on the most recent Mortgage that was taken out on this home.
Interest Rate
3.5%
Purchase Details
Closed on
Sep 16, 2016
Sold by
Robinson Brent E
Bought by
Flores Miguel A
Home Financials for this Owner
Home Financials are based on the most recent Mortgage that was taken out on this home.
Interest Rate
3.5%
Purchase Details
Closed on
Jul 29, 1997
Sold by
Parsons Daniel
Bought by
Hite Susan
Home Financials for this Owner
Home Financials are based on the most recent Mortgage that was taken out on this home.
Original Mortgage
$44,650
Interest Rate
7.81%
Mortgage Type
New Conventional
Create a Home Valuation Report for This Property
The Home Valuation Report is an in-depth analysis detailing your home's value as well as a comparison with similar homes in the area
Home Values in the Area
Average Home Value in this Area
Purchase History
| Date | Buyer | Sale Price | Title Company |
|---|---|---|---|
| Miguel A Flores | $56,250 | -- | |
| Flores Miguel A | $56,266 | Priority National Title | |
| Hite Susan | $47,000 | -- |
Source: Public Records
Mortgage History
| Date | Status | Borrower | Loan Amount |
|---|---|---|---|
| Closed | Miguel A Flores | -- | |
| Open | Flores Miguel A | $55,230 | |
| Previous Owner | Hite Susan | $44,650 |
Source: Public Records
Tax History
| Year | Tax Paid | Tax Assessment Tax Assessment Total Assessment is a certain percentage of the fair market value that is determined by local assessors to be the total taxable value of land and additions on the property. | Land | Improvement |
|---|---|---|---|---|
| 2024 | $589 | $16,570 | $2,500 | $14,070 |
| 2023 | $590 | $16,570 | $2,500 | $14,070 |
| 2022 | $587 | $16,570 | $2,500 | $14,070 |
| 2021 | $481 | $11,820 | $2,630 | $9,190 |
| 2020 | $481 | $11,820 | $2,630 | $9,190 |
| 2019 | $471 | $11,820 | $2,630 | $9,190 |
| 2018 | $481 | $11,070 | $1,880 | $9,190 |
| 2017 | $241 | $11,070 | $1,880 | $9,190 |
| 2016 | $489 | $11,070 | $1,880 | $9,190 |
| 2015 | $222 | $5,080 | $1,120 | $3,960 |
| 2014 | $222 | $5,080 | $1,120 | $3,960 |
| 2012 | $204 | $4,590 | $1,120 | $3,470 |
Source: Public Records
Map
Nearby Homes
- 213 Cherry St
- 125 Cherry St
- 523 Center St
- 706 N Cory St
- 204 Laquineo St
- 640 Center St
- 407 Washington St
- 810 Mcconnell St
- 439 Carnahan Ave
- 741 Central Ave
- 206 Midland Ave
- 322 Midland Ave
- 301 Allen Ave
- 514 Liberty St
- 1020 Country Club Dr
- 527 W Sandusky St
- 807 W Main Cross St
- 716 Winfield Ave
- 912 Parkside Place
- 1125 Glen Meadow Dr
Your Personal Tour Guide
Ask me questions while you tour the home.