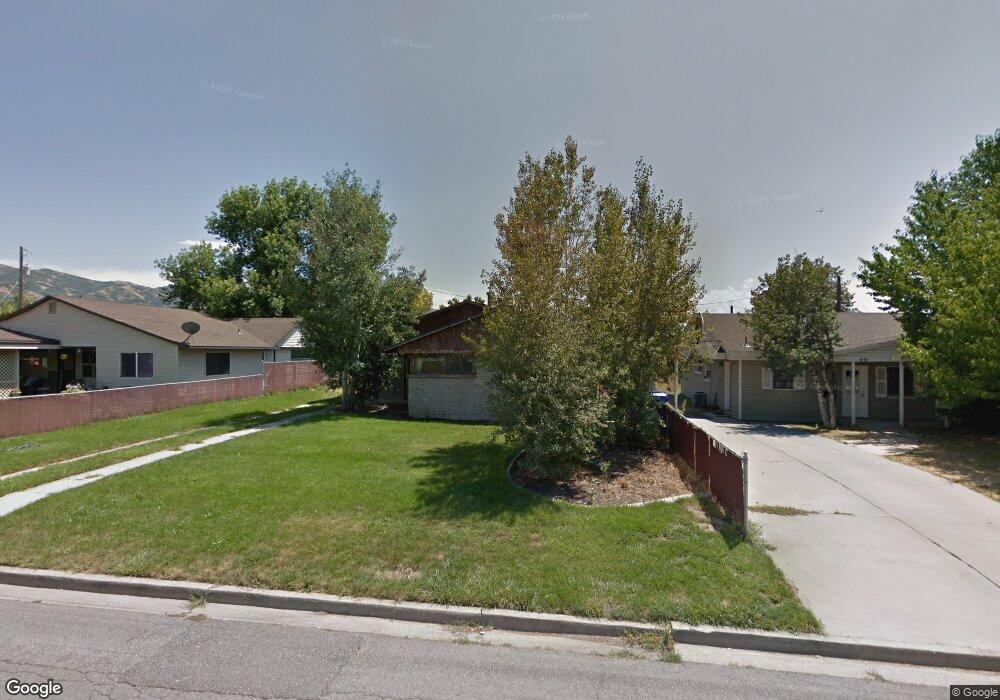
423 W 740 S Bountiful, UT 84010
Estimated Value: $443,000 - $498,000
4
Beds
2
Baths
1,235
Sq Ft
$371/Sq Ft
Est. Value
About This Home
This home is located at 423 W 740 S, Bountiful, UT 84010 and is currently estimated at $458,575, approximately $371 per square foot. 423 W 740 S is a home located in Davis County with nearby schools including Bountiful Elementary School, Millcreek Junior High School, and Bountiful High School.
Ownership History
Date
Name
Owned For
Owner Type
Purchase Details
Closed on
Mar 26, 2021
Sold by
Canyon Advantage Llc
Bought by
Hagen Grant and Hagen Adara
Current Estimated Value
Home Financials for this Owner
Home Financials are based on the most recent Mortgage that was taken out on this home.
Original Mortgage
$22,000
Outstanding Balance
$19,833
Interest Rate
3.17%
Mortgage Type
New Conventional
Estimated Equity
$438,742
Purchase Details
Closed on
Dec 14, 2020
Sold by
Roe Homes Llc
Bought by
Canyon Advantage Llc
Purchase Details
Closed on
Nov 27, 2020
Sold by
Property Seller Solutions Llc
Bought by
Roe Homes Llc
Home Financials for this Owner
Home Financials are based on the most recent Mortgage that was taken out on this home.
Original Mortgage
$157,141
Interest Rate
2.9%
Mortgage Type
Commercial
Purchase Details
Closed on
Oct 13, 2020
Sold by
Terry Michael Patrick and Estate Of Dorothy Reynolds Ter
Bought by
Property Sellar Solutions Llc
Home Financials for this Owner
Home Financials are based on the most recent Mortgage that was taken out on this home.
Original Mortgage
$157,141
Interest Rate
2.9%
Mortgage Type
Commercial
Create a Home Valuation Report for This Property
The Home Valuation Report is an in-depth analysis detailing your home's value as well as a comparison with similar homes in the area
Purchase History
| Date | Buyer | Sale Price | Title Company |
|---|---|---|---|
| Hagen Grant | -- | Title Guarantee River | |
| Canyon Advantage Llc | -- | Stewart Title Insurance A | |
| Canyon Advantage Llc | -- | Stewart Title Company | |
| Roe Homes Llc | -- | Richland Title Ins Agcy Inc | |
| Property Sellar Solutions Llc | -- | First American Title Ins Co |
Source: Public Records
Mortgage History
| Date | Status | Borrower | Loan Amount |
|---|---|---|---|
| Open | Hagen Grant | $22,000 | |
| Open | Hagen Grant | $373,117 | |
| Previous Owner | Property Sellar Solutions Llc | $157,141 |
Source: Public Records
Tax History
| Year | Tax Paid | Tax Assessment Tax Assessment Total Assessment is a certain percentage of the fair market value that is determined by local assessors to be the total taxable value of land and additions on the property. | Land | Improvement |
|---|---|---|---|---|
| 2025 | $2,478 | $225,500 | $115,838 | $109,662 |
| 2024 | $2,304 | $218,350 | $99,029 | $119,321 |
| 2023 | $2,206 | $379,000 | $186,356 | $192,644 |
| 2022 | $2,402 | $227,151 | $102,900 | $124,251 |
| 2021 | $2,201 | $318,000 | $134,487 | $183,513 |
| 2020 | $1,589 | $227,000 | $116,342 | $110,658 |
| 2019 | $1,605 | $224,000 | $133,280 | $90,720 |
| 2018 | $1,474 | $202,000 | $128,327 | $73,673 |
| 2016 | $1,253 | $92,785 | $50,861 | $41,924 |
| 2015 | $1,222 | $85,360 | $50,861 | $34,499 |
| 2014 | $1,340 | $97,243 | $50,861 | $46,382 |
| 2013 | -- | $86,137 | $36,190 | $49,947 |
Source: Public Records
Map
Nearby Homes
- 360 W 800 S
- 990 S 500 W
- 1016 S 400 W
- 109 W 900 S
- 1314 S 200 W Unit 19
- 1350 S 200 W
- 650 S Main St Unit 9106
- 1289 S 675 W
- 758 W 1000 S
- 34 W 400 S
- 32 W 400 S
- 734 W 1300 S Unit W
- 75 N Peregrine Ln W Unit 8
- 545 S 100 E
- 1601 S 700 W
- 290 N 500 W Unit 305
- 399 W 400 N Unit 47
- 332 N 300 W
- 320 N 200 W Unit 4
- 401 W 400 N Unit 49
Your Personal Tour Guide
Ask me questions while you tour the home.