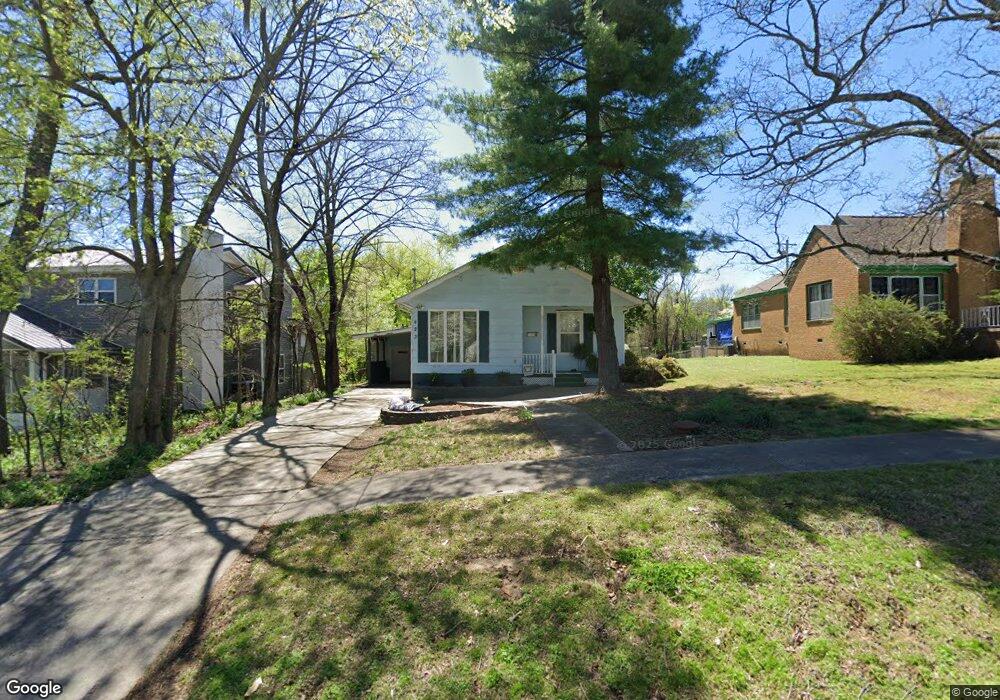
423 W Delaware St Tahlequah, OK 74464
Estimated Value: $117,000 - $171,000
2
Beds
2
Baths
1,200
Sq Ft
$127/Sq Ft
Est. Value
About This Home
This home is located at 423 W Delaware St, Tahlequah, OK 74464 and is currently estimated at $152,284, approximately $126 per square foot. 423 W Delaware St is a home located in Cherokee County with nearby schools including Greenwood Elementary School, Cherokee Elementary School, and Tahlequah Middle School.
Ownership History
Date
Name
Owned For
Owner Type
Purchase Details
Closed on
Oct 26, 2023
Sold by
Cherokee County
Bought by
United Wholesale Mortgage and Uzzo
Current Estimated Value
Purchase Details
Closed on
Jul 27, 2021
Sold by
Tinsley Ryan C and Tinsley Properties And Investm
Bought by
Tinsley Ryan Edward
Home Financials for this Owner
Home Financials are based on the most recent Mortgage that was taken out on this home.
Original Mortgage
$126,100
Interest Rate
2.9%
Mortgage Type
New Conventional
Purchase Details
Closed on
Dec 10, 2020
Sold by
Todd Brenda Lea and Todd Patricia Anne
Bought by
Tinsley Properties And Investments Inc
Purchase Details
Closed on
Apr 20, 2010
Sold by
Entley Virginia E and Entley Moore Virginia
Bought by
Virginia Entley Moore Revokable Trust
Create a Home Valuation Report for This Property
The Home Valuation Report is an in-depth analysis detailing your home's value as well as a comparison with similar homes in the area
Home Values in the Area
Average Home Value in this Area
Purchase History
| Date | Buyer | Sale Price | Title Company |
|---|---|---|---|
| United Wholesale Mortgage | $124,173 | None Listed On Document | |
| Tinsley Ryan Edward | $130,000 | Tahlequah Abstract & Ttl Co | |
| Tinsley Properties And Investments Inc | $76,000 | Tahlequah Abstract & Ttl Co | |
| Virginia Entley Moore Revokable Trust | -- | None Available |
Source: Public Records
Mortgage History
| Date | Status | Borrower | Loan Amount |
|---|---|---|---|
| Previous Owner | Tinsley Ryan Edward | $126,100 |
Source: Public Records
Tax History Compared to Growth
Tax History
| Year | Tax Paid | Tax Assessment Tax Assessment Total Assessment is a certain percentage of the fair market value that is determined by local assessors to be the total taxable value of land and additions on the property. | Land | Improvement |
|---|---|---|---|---|
| 2025 | $1,495 | $16,005 | $3,520 | $12,485 |
| 2024 | $1,521 | $16,058 | $3,520 | $12,538 |
| 2023 | $1,521 | $8,360 | $908 | $7,452 |
| 2022 | $776 | $8,360 | $908 | $7,452 |
| 2021 | $778 | $8,360 | $908 | $7,452 |
| 2020 | $309 | $3,255 | $339 | $2,916 |
| 2019 | $103 | $3,101 | $626 | $2,475 |
| 2018 | $105 | $3,101 | $626 | $2,475 |
| 2017 | $104 | $3,101 | $626 | $2,475 |
| 2016 | $105 | $3,101 | $626 | $2,475 |
| 2015 | $103 | $3,101 | $626 | $2,475 |
| 2014 | $104 | $3,101 | $626 | $2,475 |
Source: Public Records
Map
Nearby Homes
- 321 W Shawnee St
- 610 W Delaware St
- 317 W Morgan St
- 224 W Chickasaw St
- 0 W Choctaw St
- 104 S West Ave
- 807 W Choctaw St
- 813 W Choctaw St
- 510 S Cherokee Ave
- 513 S State Ave
- 702 N Jones Ave
- 403 S Bluff Ave
- 516 W Fox St
- 215 S Maple Ave
- 215 E Fuller St
- 310 York St
- 916 Coy Ave
- 201 Sandy Cir
- 402 Minor St
- 802 S College Ave
- 425 W Delaware St
- 413 W Delaware St
- 403 W Delaware St
- 412 W Delaware St
- 406 W Delaware St
- 420 W Delaware St Unit B
- 420 W Delaware St
- 420 W Delaware St Unit A
- 105 S State Ave
- 319 W Delaware St
- 321 W Delaware St
- 113 S State Ave
- 0 State Ave Unit 1623222
- 416 W Keetoowah St
- 410 W Keetoowah St
- 515 W Delaware St
- 404 W Keetoowah St
- 510 W Delaware St
- 106 S Mission Ave
- 514 W Delaware St