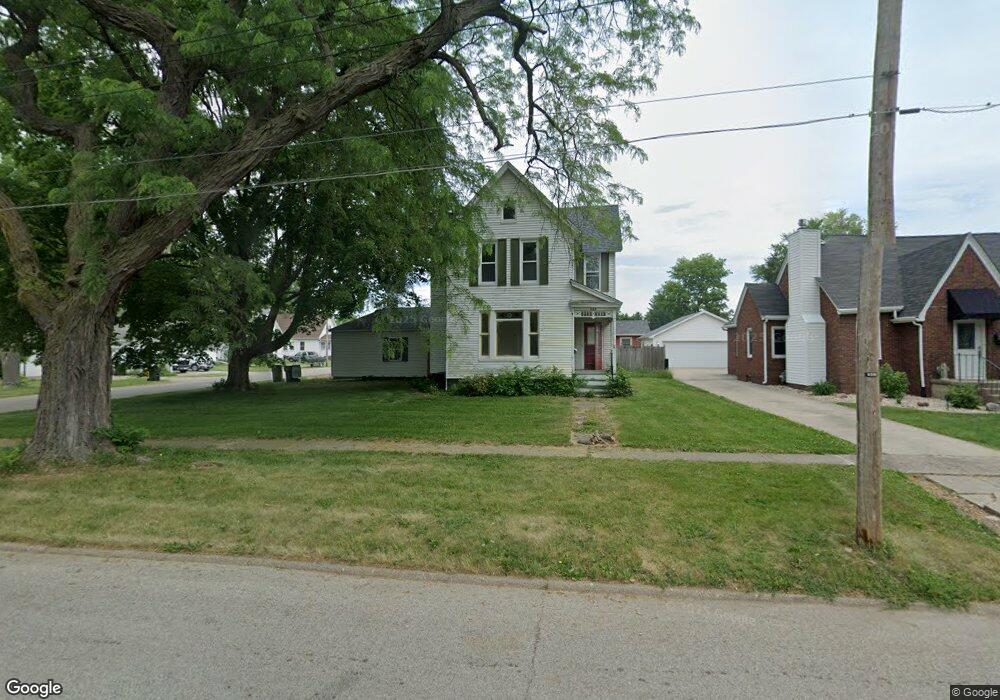
423 W Palace Row Geneseo, IL 61254
Estimated Value: $178,000 - $261,000
3
Beds
--
Bath
1,020
Sq Ft
$217/Sq Ft
Est. Value
About This Home
This home is located at 423 W Palace Row, Geneseo, IL 61254 and is currently estimated at $221,056, approximately $216 per square foot. 423 W Palace Row is a home located in Henry County with nearby schools including Geneseo High School and St. Malachy School.
Ownership History
Date
Name
Owned For
Owner Type
Purchase Details
Closed on
May 5, 2024
Sold by
Osborn Jacob W
Bought by
Girtman Noah A
Current Estimated Value
Home Financials for this Owner
Home Financials are based on the most recent Mortgage that was taken out on this home.
Original Mortgage
$210,000
Outstanding Balance
$207,381
Interest Rate
7.49%
Mortgage Type
New Conventional
Estimated Equity
$13,675
Purchase Details
Closed on
Oct 6, 2022
Sold by
Stanwich Mortgage Loan Trust
Bought by
Osborn Jacob William
Home Financials for this Owner
Home Financials are based on the most recent Mortgage that was taken out on this home.
Original Mortgage
$142,500
Interest Rate
6%
Mortgage Type
Construction
Purchase Details
Closed on
Jul 26, 2022
Sold by
Dowell David L
Bought by
Stanwich Mortgage Loan Trust
Create a Home Valuation Report for This Property
The Home Valuation Report is an in-depth analysis detailing your home's value as well as a comparison with similar homes in the area
Home Values in the Area
Average Home Value in this Area
Purchase History
| Date | Buyer | Sale Price | Title Company |
|---|---|---|---|
| Girtman Noah A | $245,000 | None Listed On Document | |
| Osborn Jacob William | $78,500 | -- | |
| Stanwich Mortgage Loan Trust | -- | None Listed On Document |
Source: Public Records
Mortgage History
| Date | Status | Borrower | Loan Amount |
|---|---|---|---|
| Open | Girtman Noah A | $210,000 | |
| Previous Owner | Osborn Jacob William | $142,500 |
Source: Public Records
Tax History Compared to Growth
Tax History
| Year | Tax Paid | Tax Assessment Tax Assessment Total Assessment is a certain percentage of the fair market value that is determined by local assessors to be the total taxable value of land and additions on the property. | Land | Improvement |
|---|---|---|---|---|
| 2024 | $5,102 | $62,767 | $5,616 | $57,151 |
| 2023 | $1,997 | $25,176 | $5,115 | $20,061 |
| 2022 | $3,157 | $38,845 | $4,754 | $34,091 |
| 2021 | $2,602 | $37,861 | $4,634 | $33,227 |
| 2020 | $2,595 | $38,213 | $4,677 | $33,536 |
| 2019 | $2,508 | $37,787 | $4,625 | $33,162 |
| 2018 | $2,354 | $35,715 | $4,371 | $31,344 |
| 2017 | $2,202 | $34,810 | $4,260 | $30,550 |
| 2016 | $2,285 | $33,928 | $4,152 | $29,776 |
| 2015 | $2,104 | $33,861 | $4,144 | $29,717 |
| 2013 | $2,104 | $33,228 | $4,067 | $29,161 |
Source: Public Records
Map
Nearby Homes
- 419 W Palace Row
- 410 N Ward St
- 503 W Palace Row
- 411 W Palace Row
- 414 N Ward St
- 411 N Ward St
- 422 W Palace Row
- 507 W Palace Row
- 413 N Ward St
- 407 W Palace Row
- 418 N Ward St
- 416 W Palace Row
- 329 N Ward St
- 415 N Ward St
- 415 N Vail St
- 403 W Palace Row
- 419 N Vail St
- 513 W Palace Row
- 339 N Vail St
- 422 W Wells St