423 West Ave Kannapolis, NC 28081
Estimated Value: $193,000 - $278,000
2
Beds
1
Bath
1,464
Sq Ft
$163/Sq Ft
Est. Value
About This Home
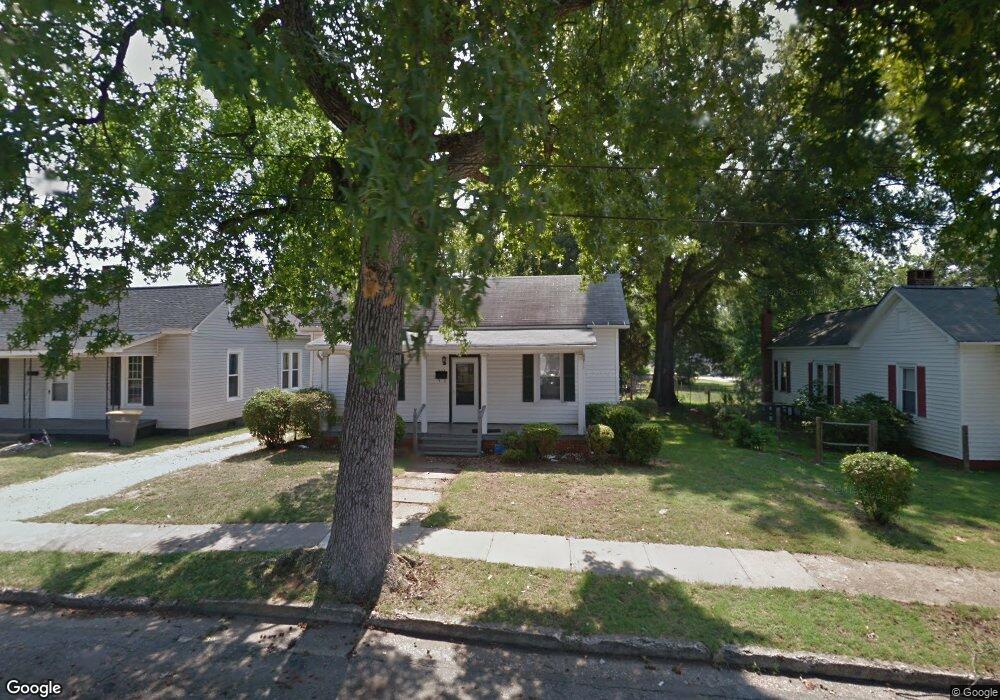
This home is located at 423 West Ave, Kannapolis, NC 28081 and is currently estimated at $239,068, approximately $163 per square foot. 423 West Ave is a home located in Cabarrus County with nearby schools including Fred L. Wilson Elementary School, Kannapolis Middle, and A.L. Brown High School.
Ownership History
Date
Name
Owned For
Owner Type
Purchase Details
Closed on
Aug 6, 2019
Sold by
Roberts Margie H
Bought by
Roberts Margie H and Margie H Roberts Revocable Tru
Current Estimated Value
Purchase Details
Closed on
Nov 1, 1994
Purchase Details
Closed on
Sep 1, 1987
Create a Home Valuation Report for This Property
The Home Valuation Report is an in-depth analysis detailing your home's value as well as a comparison with similar homes in the area
Home Values in the Area
Average Home Value in this Area
Purchase History
| Date | Buyer | Sale Price | Title Company |
|---|---|---|---|
| Roberts Margie H | -- | None Available | |
| -- | -- | -- | |
| -- | $21,500 | -- |
Source: Public Records
Tax History Compared to Growth
Tax History
| Year | Tax Paid | Tax Assessment Tax Assessment Total Assessment is a certain percentage of the fair market value that is determined by local assessors to be the total taxable value of land and additions on the property. | Land | Improvement |
|---|---|---|---|---|
| 2025 | $2,554 | $224,900 | $85,000 | $139,900 |
| 2024 | $2,554 | $224,900 | $85,000 | $139,900 |
| 2023 | $2,228 | $162,640 | $118,910 | $43,730 |
| 2022 | $2,228 | $162,640 | $118,910 | $43,730 |
| 2021 | $2,228 | $162,640 | $118,910 | $43,730 |
| 2020 | $2,228 | $162,640 | $118,910 | $43,730 |
| 2019 | $1,167 | $85,160 | $38,500 | $46,660 |
| 2018 | $1,150 | $85,160 | $38,500 | $46,660 |
| 2017 | $1,133 | $85,160 | $38,500 | $46,660 |
| 2016 | $1,133 | $92,190 | $44,270 | $47,920 |
| 2015 | $1,162 | $92,190 | $44,270 | $47,920 |
| 2014 | $1,162 | $92,190 | $44,270 | $47,920 |
Source: Public Records
Map
Nearby Homes
- 5941 Mantle Way
- 5880 Mantle Way
- 3131 Baines Ct
- 3161 Baines Ct
- 00 Centergrove Rd
- 5840 Pittmon Ln
- 5850 Pittmon Ln
- 5820 Pittmon Ln
- 5860 Pittmon Ln
- 335 Vance St
- 500 Broad St
- 304 Bell St
- 202 Milton L Taylor St
- 417 York Ave
- 226 York Ave
- 427 Pleasant Ave
- 604 Frank St
- 100 N Ridge Ave
- 803 Desoto Ave
- Lot 1 Pleasant Ave
- 421 West Ave
- 425 West Ave
- 427 West Ave
- 5971 Mantle Way
- 131 W F St
- 5950 Mantle Way
- 121 W F St
- 5961 Mantle Way
- 5670 Comiskey Alley
- 424 West Ave
- 422 West Ave
- 429 West Ave
- 5660 Comiskey Alley
- 5940 Mantle Way
- 426 West Ave
- 5650 Comiskey Alley
- 420 West Ave
- 5931 Mantle Way
- 5930 Mantle Way
- 5640 Comiskey Alley