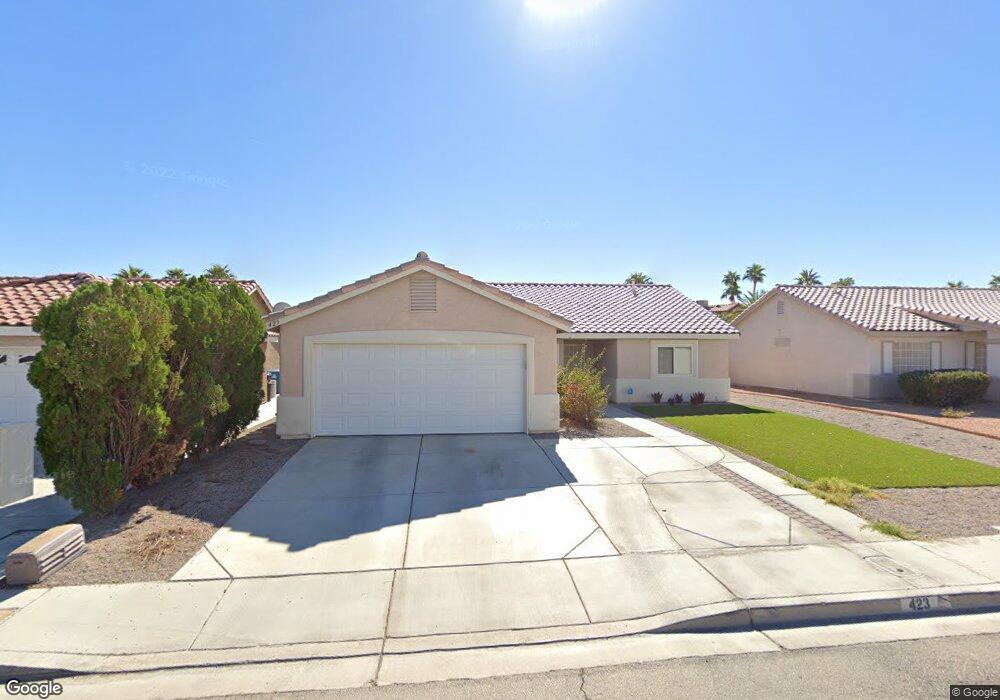
423 Yarnell Dr Unit 2 North Las Vegas, NV 89031
Craig Ranch NeighborhoodEstimated Value: $373,000 - $392,000
3
Beds
2
Baths
1,374
Sq Ft
$278/Sq Ft
Est. Value
About This Home
This home is located at 423 Yarnell Dr Unit 2, North Las Vegas, NV 89031 and is currently estimated at $382,313, approximately $278 per square foot. 423 Yarnell Dr Unit 2 is a home located in Clark County with nearby schools including Fredric W. Watson Elementary School, Clifford O. Findlay Middle School, and Mojave High School.
Ownership History
Date
Name
Owned For
Owner Type
Purchase Details
Closed on
Jun 17, 2014
Sold by
Bailey Roy W
Bought by
Bailey Roy W and Brown Machel E
Current Estimated Value
Purchase Details
Closed on
Mar 29, 2011
Sold by
Brown Machel E
Bought by
Bailey Roy W
Home Financials for this Owner
Home Financials are based on the most recent Mortgage that was taken out on this home.
Original Mortgage
$87,338
Outstanding Balance
$60,704
Interest Rate
4.96%
Mortgage Type
VA
Estimated Equity
$321,609
Purchase Details
Closed on
Oct 4, 2010
Sold by
Brown Richard
Bought by
Federal National Mortgage Association
Purchase Details
Closed on
Dec 6, 1995
Sold by
Inco Homes Corp
Bought by
Brown Richard
Home Financials for this Owner
Home Financials are based on the most recent Mortgage that was taken out on this home.
Original Mortgage
$99,284
Interest Rate
7.48%
Mortgage Type
FHA
Create a Home Valuation Report for This Property
The Home Valuation Report is an in-depth analysis detailing your home's value as well as a comparison with similar homes in the area
Home Values in the Area
Average Home Value in this Area
Purchase History
| Date | Buyer | Sale Price | Title Company |
|---|---|---|---|
| Bailey Roy W | -- | None Available | |
| Bailey Roy W | -- | Stewart Title Of Nevada | |
| Bailey Roy W | $85,500 | Stewart Title Of Nevada | |
| Federal National Mortgage Association | $126,830 | First American National Defa | |
| Brown Richard | $100,500 | Nevada Title Company |
Source: Public Records
Mortgage History
| Date | Status | Borrower | Loan Amount |
|---|---|---|---|
| Open | Bailey Roy W | $87,338 | |
| Previous Owner | Brown Richard | $99,284 |
Source: Public Records
Tax History Compared to Growth
Tax History
| Year | Tax Paid | Tax Assessment Tax Assessment Total Assessment is a certain percentage of the fair market value that is determined by local assessors to be the total taxable value of land and additions on the property. | Land | Improvement |
|---|---|---|---|---|
| 2025 | $1,209 | $88,227 | $31,500 | $56,727 |
| 2024 | $1,174 | $88,227 | $31,500 | $56,727 |
| 2023 | $1,174 | $80,002 | $25,900 | $54,102 |
| 2022 | $1,140 | $72,642 | $23,100 | $49,542 |
| 2021 | $1,107 | $68,003 | $20,650 | $47,353 |
| 2020 | $1,110 | $66,891 | $19,950 | $46,941 |
| 2019 | $1,040 | $62,426 | $16,100 | $46,326 |
| 2018 | $993 | $57,458 | $12,600 | $44,858 |
| 2017 | $1,849 | $55,136 | $11,900 | $43,236 |
| 2016 | $930 | $46,616 | $8,400 | $38,216 |
| 2015 | $928 | $34,290 | $5,950 | $28,340 |
| 2014 | $900 | $27,178 | $4,900 | $22,278 |
Source: Public Records
Map
Nearby Homes
- 5243 Willowdale Ct
- 524 Rancho Del Sol Way
- 5228 Daywood St
- 429 Orchid Oasis Ave
- 5136 Stonecrop St
- 449 Orchid Oasis Ave
- 5243 Edna Crane Ave
- 5038 Vista Del Rio Way
- 621 Carlos Julio Ave
- 5313 Jeremy David St
- 648 Carlos Julio Ave
- 229 Stagecoach Flats Ave
- 654 Roberta Alecia Ave
- 212 Stagecoach Flats Ave
- 3601 Allen Creek Ct
- 4915 Via Luis Ct
- 727 Roberta Alecia Ave
- 438 Shimmering Sands Ave
- 5523 Jose Leon St
- 921 Evening Fawn Dr
- 419 Yarnell Dr
- 427 Yarnell Dr
- 5247 Willowdale Ct
- 431 Yarnell Dr
- 415 Yarnell Dr
- 5315 Sable Ct
- 5246 Willowdale Ct
- 5246 Southern Cypress Ct
- 5242 Southern Cypress Ct
- 411 Yarnell Dr
- 435 Yarnell Dr
- 5316 Padero Dr
- 5319 Sable Ct
- 5239 Willowdale Ct
- 5242 Willowdale Ct
- 5238 Southern Cypress Ct
- 5318 Sable Ct
- 5320 Padero Dr
- 5238 Willowdale Ct