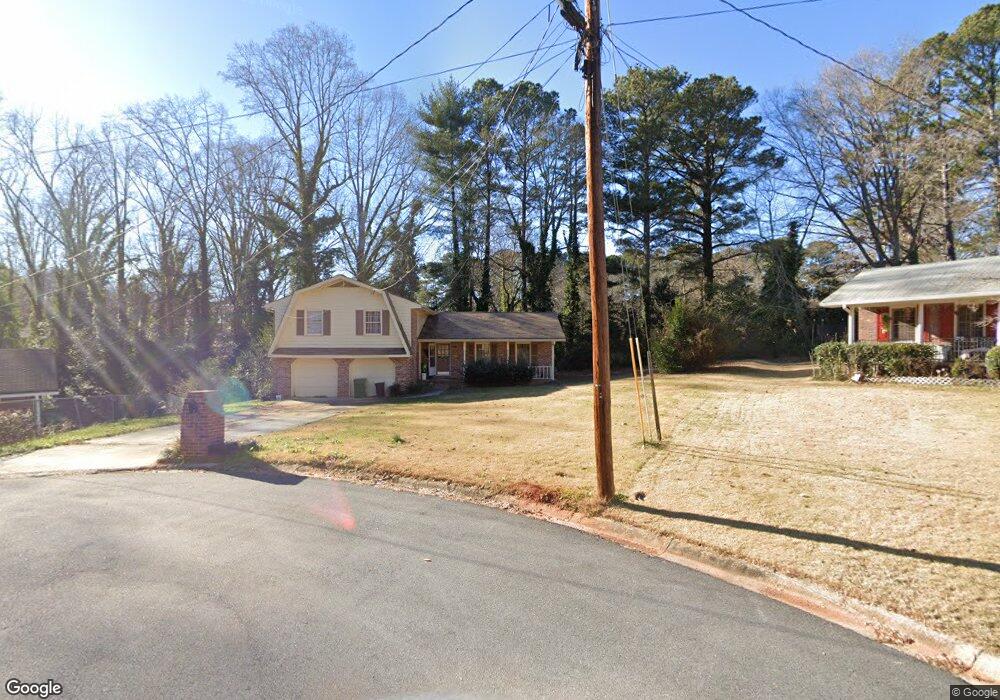
4230 Bingham Ct Unit 2 Stone Mountain, GA 30083
Estimated Value: $290,000 - $334,000
3
Beds
3
Baths
2,097
Sq Ft
$150/Sq Ft
Est. Value
About This Home
This home is located at 4230 Bingham Ct Unit 2, Stone Mountain, GA 30083 and is currently estimated at $314,194, approximately $149 per square foot. 4230 Bingham Ct Unit 2 is a home located in DeKalb County with nearby schools including Jolly Elementary School, Freedom Middle School, and Clarkston High School.
Ownership History
Date
Name
Owned For
Owner Type
Purchase Details
Closed on
Sep 19, 2002
Sold by
Zere Woldai T
Bought by
Zere Woldai
Current Estimated Value
Home Financials for this Owner
Home Financials are based on the most recent Mortgage that was taken out on this home.
Original Mortgage
$125,900
Outstanding Balance
$52,401
Interest Rate
6.19%
Mortgage Type
New Conventional
Estimated Equity
$261,793
Purchase Details
Closed on
Sep 16, 2002
Sold by
Citifinancial Mtg Co
Bought by
Zere Woldai T
Home Financials for this Owner
Home Financials are based on the most recent Mortgage that was taken out on this home.
Original Mortgage
$125,900
Outstanding Balance
$52,401
Interest Rate
6.19%
Mortgage Type
New Conventional
Estimated Equity
$261,793
Purchase Details
Closed on
Apr 2, 2002
Sold by
Smith Garland T
Bought by
Citifinancial Mtg Co
Purchase Details
Closed on
Mar 3, 1995
Sold by
Lindholm Sue C
Bought by
Smith Garland T Felicia
Create a Home Valuation Report for This Property
The Home Valuation Report is an in-depth analysis detailing your home's value as well as a comparison with similar homes in the area
Home Values in the Area
Average Home Value in this Area
Purchase History
| Date | Buyer | Sale Price | Title Company |
|---|---|---|---|
| Zere Woldai | -- | -- | |
| Zere Woldai T | $139,900 | -- | |
| Citifinancial Mtg Co | $32,000 | -- | |
| Smith Garland T Felicia | $87,000 | -- |
Source: Public Records
Mortgage History
| Date | Status | Borrower | Loan Amount |
|---|---|---|---|
| Open | Zere Woldai T | $125,900 | |
| Closed | Smith Garland T Felicia | $0 |
Source: Public Records
Tax History Compared to Growth
Tax History
| Year | Tax Paid | Tax Assessment Tax Assessment Total Assessment is a certain percentage of the fair market value that is determined by local assessors to be the total taxable value of land and additions on the property. | Land | Improvement |
|---|---|---|---|---|
| 2025 | $884 | $126,800 | $28,000 | $98,800 |
| 2024 | $948 | $115,040 | $28,000 | $87,040 |
| 2023 | $948 | $122,360 | $28,000 | $94,360 |
| 2022 | $863 | $82,120 | $20,000 | $62,120 |
| 2021 | $2,018 | $60,360 | $20,000 | $40,360 |
| 2020 | $1,837 | $54,960 | $8,280 | $46,680 |
| 2019 | $1,833 | $55,400 | $8,280 | $47,120 |
| 2018 | $1,791 | $56,320 | $8,280 | $48,040 |
| 2017 | $1,811 | $53,000 | $8,280 | $44,720 |
| 2016 | $1,841 | $55,160 | $8,280 | $46,880 |
| 2014 | $1,313 | $39,920 | $8,280 | $31,640 |
Source: Public Records
Map
Nearby Homes
- 4247 Bingham Ct
- 1042 Cedar Forest Ct
- 1092 Alpco Ct
- 1075 Forest Heights Rd
- 868 Maxey Hill Ct
- 1111 Gunnison Ct Unit 4
- 4027 Stoneview Cir
- 4424 Central Dr
- 798 Windchase Ln
- 4467 Boatmans Cove
- 4362 Timberlake Unit 4362
- 4358 Timberlake
- 4468 Anderson Rd
- 4351 Timberlake
- 4362 Thunder Fork Dr
- 695 Windchase Ln
- 596 Windchase Ln Unit 596
- 4239 Bingham Ct
- 0 Dunstan Ln Unit 7026991
- 0 Dunstan Ln Unit 3240711
- 957 Dunstan Ln
- 4238 Bingham Ct
- 949 Dunstan Ln
- 965 Dunstan Ln
- 941 Dunstan Ln Unit 2
- 4244 Bingham Ct Unit 2
- 0 Bingham Ct Unit 8965963
- 0 Bingham Ct Unit 9024210
- 0 Bingham Ct Unit 8055541
- 0 Bingham Ct
- 4232 Abingdon Dr
- 4252 Bingham Ct
- 4237 Dunstan Ct
- 4245 Dunstan Ct Unit 2
- 4229 Dunstan Ct Unit 2
- 4255 Bingham Ct Unit 2
- 4214 Abingdon Dr Unit 1