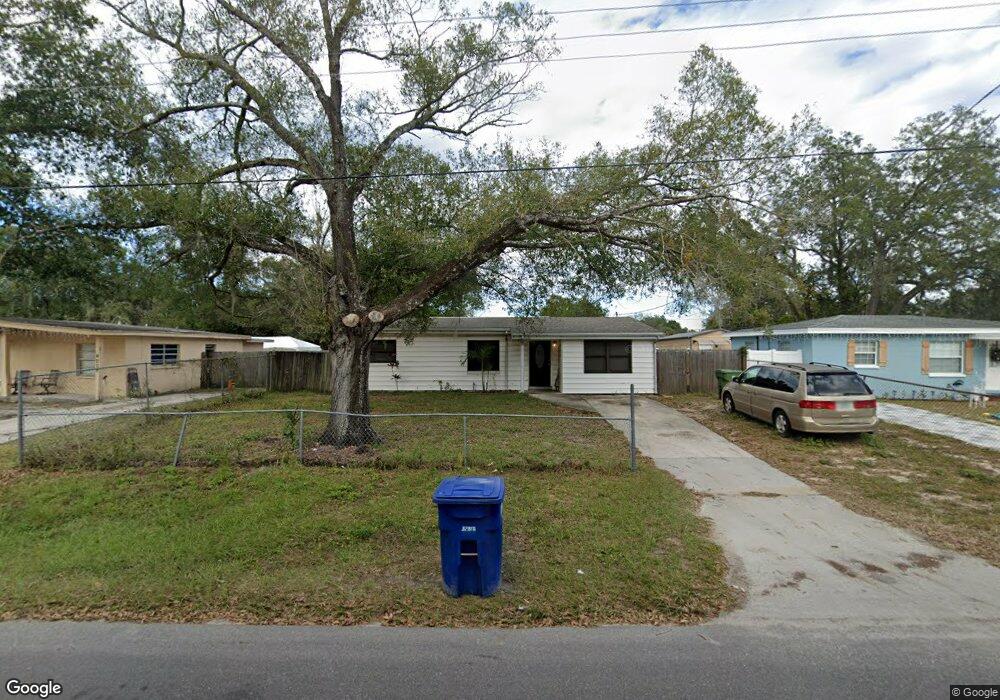
4230 N Sandalwood Cir Tampa, FL 33617
Temple Crest NeighborhoodEstimated Value: $168,000 - $250,000
2
Beds
1
Bath
1,034
Sq Ft
$206/Sq Ft
Est. Value
About This Home
This home is located at 4230 N Sandalwood Cir, Tampa, FL 33617 and is currently estimated at $212,487, approximately $205 per square foot. 4230 N Sandalwood Cir is a home located in Hillsborough County with nearby schools including Kimbell Elementary School, Sligh Middle School, and Wharton High School.
Ownership History
Date
Name
Owned For
Owner Type
Purchase Details
Closed on
Apr 12, 2017
Sold by
Rahman Ejajur
Bought by
Ny2 Tampa Llc
Current Estimated Value
Purchase Details
Closed on
Oct 21, 2016
Sold by
Capital One Na
Bought by
Rahman Ejajur
Purchase Details
Closed on
Jan 26, 2016
Sold by
Bergmann Brian K and Carver Sandra
Bought by
Capital One Na
Purchase Details
Closed on
May 1, 2006
Sold by
Carver Lucile and Carver Sandra
Bought by
Bergmann Brian K
Home Financials for this Owner
Home Financials are based on the most recent Mortgage that was taken out on this home.
Original Mortgage
$128,250
Interest Rate
6.5%
Mortgage Type
Fannie Mae Freddie Mac
Purchase Details
Closed on
Apr 2, 1996
Sold by
Carver Clifton Carver W and Carver Lucile
Bought by
Carver Lucile
Create a Home Valuation Report for This Property
The Home Valuation Report is an in-depth analysis detailing your home's value as well as a comparison with similar homes in the area
Home Values in the Area
Average Home Value in this Area
Purchase History
| Date | Buyer | Sale Price | Title Company |
|---|---|---|---|
| Ny2 Tampa Llc | -- | Anchor Title & Associates | |
| Rahman Ejajur | $75,600 | Premium Title Services Inc | |
| Capital One Na | $28,400 | None Available | |
| Bergmann Brian K | $135,000 | Bankers Title | |
| Carver Lucile | $100 | -- |
Source: Public Records
Mortgage History
| Date | Status | Borrower | Loan Amount |
|---|---|---|---|
| Previous Owner | Bergmann Brian K | $128,250 |
Source: Public Records
Tax History Compared to Growth
Tax History
| Year | Tax Paid | Tax Assessment Tax Assessment Total Assessment is a certain percentage of the fair market value that is determined by local assessors to be the total taxable value of land and additions on the property. | Land | Improvement |
|---|---|---|---|---|
| 2024 | $2,291 | $133,355 | $54,627 | $78,728 |
| 2023 | $2,127 | $124,712 | $47,799 | $76,913 |
| 2022 | $2,010 | $123,424 | $44,385 | $79,039 |
| 2021 | $1,724 | $85,352 | $29,021 | $56,331 |
| 2020 | $1,558 | $73,434 | $22,192 | $51,242 |
| 2019 | $1,447 | $67,572 | $20,485 | $47,087 |
| 2018 | $1,350 | $62,066 | $0 | $0 |
| 2017 | $1,053 | $47,245 | $0 | $0 |
| 2016 | $853 | $36,826 | $0 | $0 |
| 2015 | $772 | $33,478 | $0 | $0 |
| 2014 | -- | $30,435 | $0 | $0 |
| 2013 | -- | $27,668 | $0 | $0 |
Source: Public Records
Map
Nearby Homes
- 4216 E Yukon St
- 4220 E Regnas Ave
- 8614 N Orangeview Ave
- 8403 N 46th St
- 8738 N Tangerine Place
- 8605 N 48th St
- 8705 N 48th St
- 8703 N 48th St
- 8416 N 39th St
- 8715 N Temple Ave
- 8006 N Temple Place
- 8715 N 37th St
- 4616 River Hills Dr
- 4220 E Eva St
- 4607 Riverhills Dr
- 4212 E Alene Dr
- 4117 E Sewaha St
- 8719 N Larkhall Place
- 4109 Temple Heights Rd
- 4213 Temple Heights Rd
- 4228 N Sandalwood Cir
- 4227 E Yukon St
- 4225 E Yukon St
- 4234 N Sandalwood Cir
- 4226 N Sandalwood Cir
- 4229 E Yukon St Unit 1
- 4223 E Yukon St
- 4229 N Sandalwood Cir
- 4231 E Yukon St
- 4227 N Sandalwood Cir
- 4231 N Sandalwood Cir
- 4224 N Sandalwood Cir
- 4233 N Sandalwood Cir
- 4225 N Sandalwood Cir
- 4221 E Yukon St
- 8702 N Tangerine Place
- 4223 N Sandalwood Cir
- 4222 N Sandalwood Cir
- 4230 E Yukon St
- 4506 E Yukon St