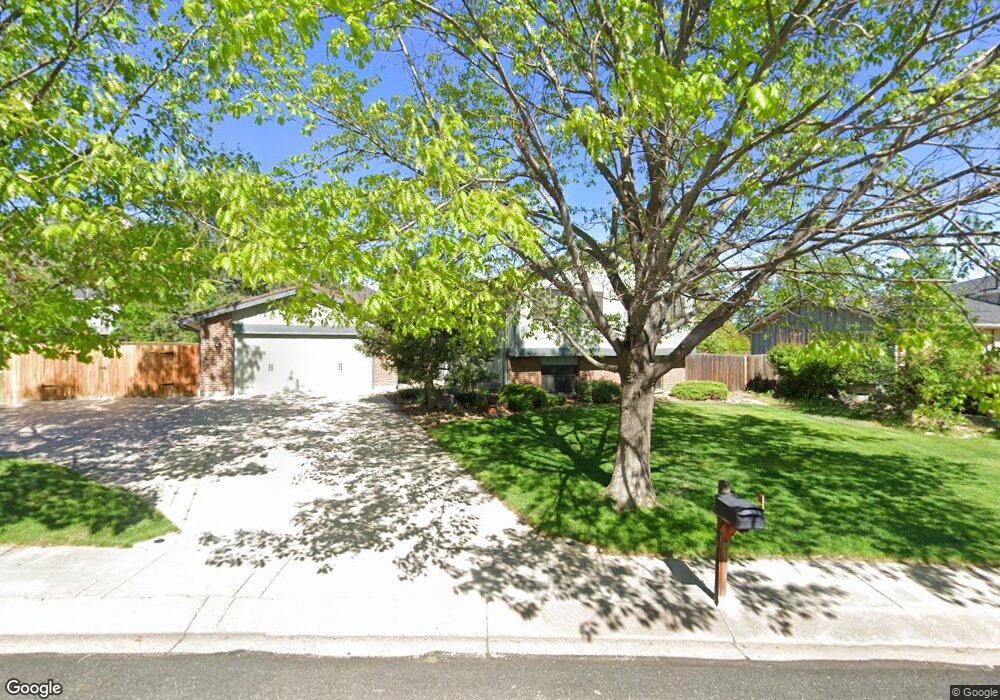
4230 Stonehaven Dr Colorado Springs, CO 80906
Broadmoor Bluff NeighborhoodEstimated Value: $620,806 - $663,000
4
Beds
3
Baths
1,496
Sq Ft
$433/Sq Ft
Est. Value
About This Home
This home is located at 4230 Stonehaven Dr, Colorado Springs, CO 80906 and is currently estimated at $647,452, approximately $432 per square foot. 4230 Stonehaven Dr is a home located in El Paso County with nearby schools including Pinon Valley Elementary School, Cheyenne Mountain Junior High School, and Cheyenne Mountain High School.
Ownership History
Date
Name
Owned For
Owner Type
Purchase Details
Closed on
Oct 23, 2020
Sold by
Lee Linda M and Lee George E
Bought by
Daugherty Jeffrey and Daugherty Gina
Current Estimated Value
Home Financials for this Owner
Home Financials are based on the most recent Mortgage that was taken out on this home.
Original Mortgage
$472,215
Outstanding Balance
$420,010
Interest Rate
2.9%
Mortgage Type
VA
Estimated Equity
$227,442
Purchase Details
Closed on
Sep 18, 2020
Sold by
Bentz Eva C
Bought by
Lee George E and Lee Linda M
Home Financials for this Owner
Home Financials are based on the most recent Mortgage that was taken out on this home.
Original Mortgage
$472,215
Outstanding Balance
$420,010
Interest Rate
2.9%
Mortgage Type
VA
Estimated Equity
$227,442
Purchase Details
Closed on
Jul 6, 2018
Sold by
Crane Robert C and Crane Patricia L
Bought by
Lee Linda M and Lee George E
Purchase Details
Closed on
Jun 27, 2018
Sold by
Crane Robert C and Crane Patricia L
Bought by
Bentz Eva C
Create a Home Valuation Report for This Property
The Home Valuation Report is an in-depth analysis detailing your home's value as well as a comparison with similar homes in the area
Home Values in the Area
Average Home Value in this Area
Purchase History
| Date | Buyer | Sale Price | Title Company |
|---|---|---|---|
| Daugherty Jeffrey | $489,000 | Land Title Guarantee Company | |
| Lee George E | -- | Land Title Guarantee Company | |
| Lee Linda M | $452,000 | Land Title | |
| Bentz Eva C | -- | Land Title |
Source: Public Records
Mortgage History
| Date | Status | Borrower | Loan Amount |
|---|---|---|---|
| Open | Daugherty Jeffrey | $472,215 |
Source: Public Records
Tax History Compared to Growth
Tax History
| Year | Tax Paid | Tax Assessment Tax Assessment Total Assessment is a certain percentage of the fair market value that is determined by local assessors to be the total taxable value of land and additions on the property. | Land | Improvement |
|---|---|---|---|---|
| 2025 | $2,563 | $44,280 | -- | -- |
| 2024 | $2,463 | $40,940 | $7,540 | $33,400 |
| 2023 | $2,463 | $40,940 | $7,540 | $33,400 |
| 2022 | $2,063 | $30,270 | $6,500 | $23,770 |
| 2021 | $2,178 | $31,140 | $6,690 | $24,450 |
| 2020 | $2,065 | $28,780 | $5,360 | $23,420 |
| 2019 | $2,042 | $28,780 | $5,360 | $23,420 |
| 2018 | $1,221 | $24,090 | $4,680 | $19,410 |
| 2017 | $1,216 | $24,090 | $4,680 | $19,410 |
| 2016 | $1,220 | $25,360 | $5,170 | $20,190 |
| 2015 | $1,217 | $25,360 | $5,170 | $20,190 |
| 2014 | $1,134 | $24,160 | $4,270 | $19,890 |
Source: Public Records
Map
Nearby Homes
- 4225 Edinburgh Ct
- 4220 Cromwell Ct
- 4240 Edinburgh Ct
- 3820 Becket Dr
- 635 Royal Oak Dr
- 416 Cobblestone Dr
- 412 Cobblestone Dr
- 310 Cobblestone Dr
- 570 Brandywine Dr
- 906 London Green Way
- 290 Cobblestone Dr
- 422 Cobblestone Dr
- 4019 San Felice Point
- 262 Cobblestone Dr Unit 81
- 938 London Green Way
- 1244 Samuel Point Unit 1
- 4573 Prestige Point
- 3930 Leah Heights Unit 16
- 3914 Leah Heights Unit 108
- 4446 Spiceglen Dr
- 4240 Stonehaven Dr
- 4220 Stonehaven Dr
- 3985 Becket Dr
- 4210 Edinburgh Ct
- 4005 Becket Dr
- 4235 Stonehaven Dr
- 4050 Wolcott Place
- 4225 Stonehaven Dr
- 3955 Becket Dr
- 4025 Becket Dr
- 4245 Stonehaven Dr
- 3925 Becket Dr
- 4215 Stonehaven Dr
- 4220 Edinburgh Ct
- 4030 Wolcott Place
- 4170 Stepney Ct
- 4190 Stepney Ct
- 3960 Becket Dr
- 4315 Stonehaven Dr
- 4310 Stonehaven Dr