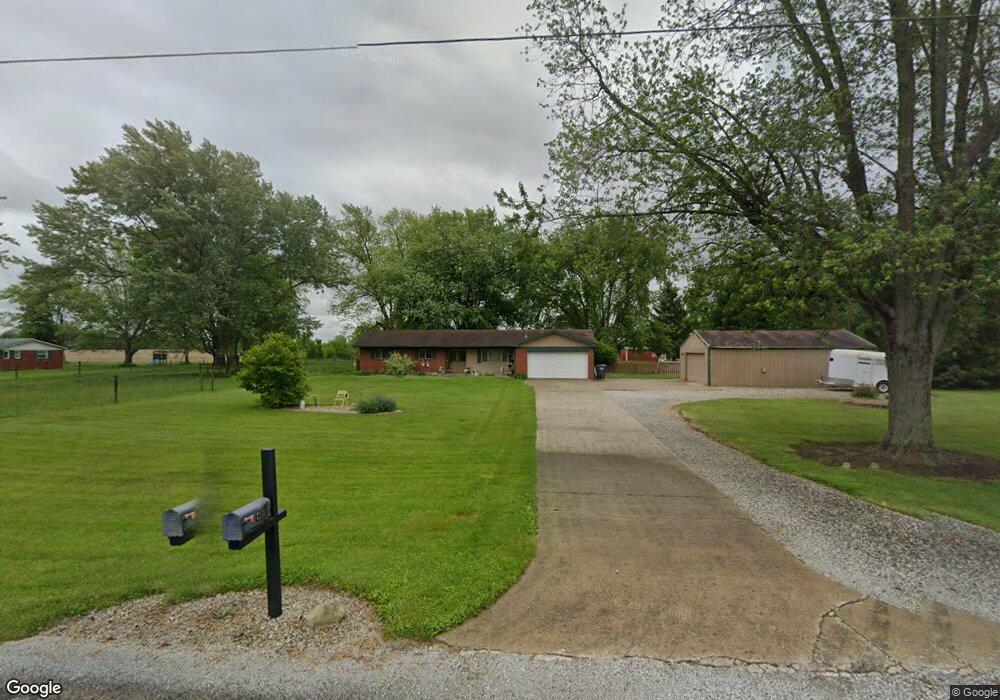
4231 E 1100 N Pendleton, IN 46064
Estimated Value: $297,000 - $468,901
3
Beds
2
Baths
1,476
Sq Ft
$249/Sq Ft
Est. Value
About This Home
This home is located at 4231 E 1100 N, Pendleton, IN 46064 and is currently estimated at $367,225, approximately $248 per square foot. 4231 E 1100 N is a home located in Hancock County with nearby schools including Eden Elementary School, Maxwell Intermediate School, and Greenfield Central Junior High School.
Ownership History
Date
Name
Owned For
Owner Type
Purchase Details
Closed on
Apr 24, 2021
Sold by
Farr Tracy Lee and Dunson Tracy Lee
Bought by
Farr Tracy
Current Estimated Value
Home Financials for this Owner
Home Financials are based on the most recent Mortgage that was taken out on this home.
Original Mortgage
$171,000
Outstanding Balance
$152,439
Interest Rate
2.9%
Mortgage Type
New Conventional
Estimated Equity
$214,786
Purchase Details
Closed on
Sep 2, 2015
Sold by
Robert
Bought by
Tracy
Create a Home Valuation Report for This Property
The Home Valuation Report is an in-depth analysis detailing your home's value as well as a comparison with similar homes in the area
Purchase History
| Date | Buyer | Sale Price | Title Company |
|---|---|---|---|
| Farr Tracy | -- | Timios Inc | |
| Tracy | $173,000 | -- |
Source: Public Records
Mortgage History
| Date | Status | Borrower | Loan Amount |
|---|---|---|---|
| Open | Farr Tracy | $171,000 |
Source: Public Records
Tax History
| Year | Tax Paid | Tax Assessment Tax Assessment Total Assessment is a certain percentage of the fair market value that is determined by local assessors to be the total taxable value of land and additions on the property. | Land | Improvement |
|---|---|---|---|---|
| 2024 | $2,367 | $356,100 | $83,900 | $272,200 |
| 2023 | $2,367 | $328,000 | $83,900 | $244,100 |
| 2022 | $1,869 | $268,500 | $47,200 | $221,300 |
| 2021 | $1,578 | $227,800 | $43,100 | $184,700 |
| 2020 | $1,585 | $222,800 | $43,000 | $179,800 |
| 2019 | $1,534 | $214,600 | $43,300 | $171,300 |
| 2018 | $1,551 | $215,000 | $43,300 | $171,700 |
| 2017 | $1,617 | $210,300 | $43,600 | $166,700 |
| 2016 | $1,649 | $199,900 | $42,300 | $157,600 |
| 2014 | $1,455 | $178,600 | $43,300 | $135,300 |
| 2013 | $1,455 | $174,500 | $43,300 | $131,200 |
Source: Public Records
Map
Nearby Homes
- 10517 N Barnard Rd
- 10274 S 400 W
- 3981 W 1000 S
- 9271 N 400 E
- 00 1050 County Rd S
- 9938 S State Road 9
- 0 E 1000 N Unit 11607696
- 9694 S State Road 9
- 1722 Fair Weather Dr
- I 69 State Road 38
- 1754 Creek Bed Ln
- 1685 Fair Weather Dr
- 234 Winding Brook Way
- 0 N Nashville Rd Unit MBR22064069
- 0 N Nashville Rd Unit LotWP001 24911804
- 600 E North St N
- 1666 Huntzinger Blvd
- 56 Winding Brook Way
- 8329 S 300 W
- 1921 Cold Springs Dr
Your Personal Tour Guide
Ask me questions while you tour the home.