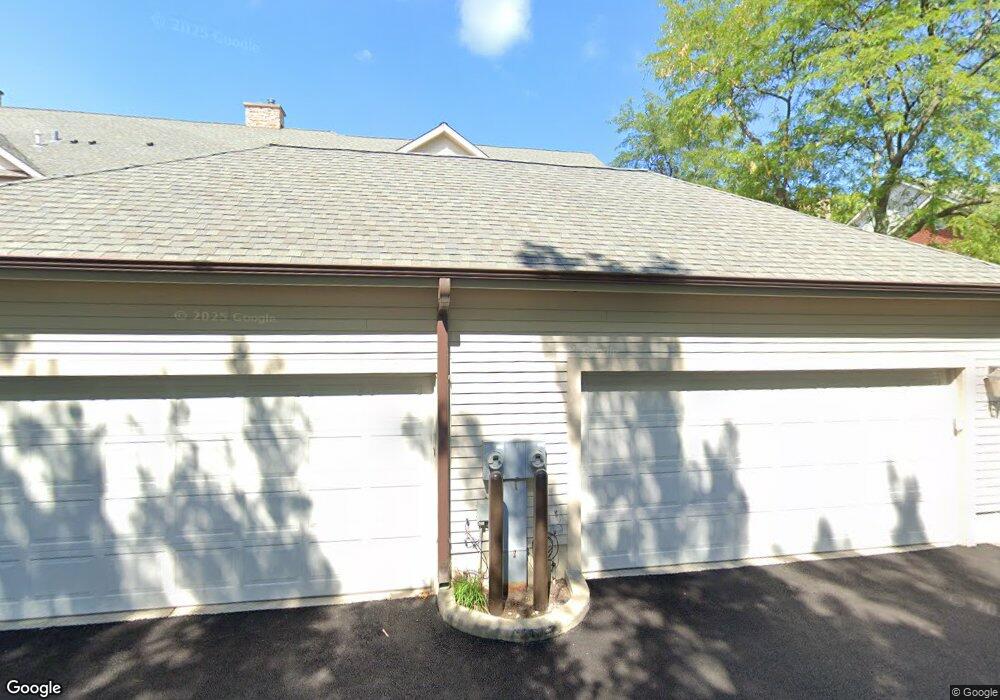
4231 Linden Tree Ln Unit 1 Glenview, IL 60026
Estimated Value: $575,000 - $645,000
3
Beds
3
Baths
2,001
Sq Ft
$305/Sq Ft
Est. Value
About This Home
This home is located at 4231 Linden Tree Ln Unit 1, Glenview, IL 60026 and is currently estimated at $610,406, approximately $305 per square foot. 4231 Linden Tree Ln Unit 1 is a home located in Cook County with nearby schools including Henry Winkelman Elementary School, Field Middle School, and Glenbrook South High School.
Ownership History
Date
Name
Owned For
Owner Type
Purchase Details
Closed on
Sep 21, 2016
Sold by
Chol Myung Chil and Choi Jung Lim
Bought by
Choi Myung Chil and Choi Jung Lim
Current Estimated Value
Purchase Details
Closed on
Sep 26, 2006
Sold by
Arends Bernard
Bought by
Arends Bernard H and Bernard H Arends Jr Trust
Purchase Details
Closed on
Oct 6, 2005
Sold by
Linden Tree Venture Corp
Bought by
Arends Bernard H
Home Financials for this Owner
Home Financials are based on the most recent Mortgage that was taken out on this home.
Original Mortgage
$393,000
Outstanding Balance
$207,267
Interest Rate
5.82%
Mortgage Type
Fannie Mae Freddie Mac
Estimated Equity
$403,139
Create a Home Valuation Report for This Property
The Home Valuation Report is an in-depth analysis detailing your home's value as well as a comparison with similar homes in the area
Home Values in the Area
Average Home Value in this Area
Purchase History
| Date | Buyer | Sale Price | Title Company |
|---|---|---|---|
| Choi Myung Chil | -- | None Available | |
| Arends Bernard H | -- | None Available | |
| Arends Bernard H | $549,000 | Ticor |
Source: Public Records
Mortgage History
| Date | Status | Borrower | Loan Amount |
|---|---|---|---|
| Open | Arends Bernard H | $393,000 |
Source: Public Records
Tax History
| Year | Tax Paid | Tax Assessment Tax Assessment Total Assessment is a certain percentage of the fair market value that is determined by local assessors to be the total taxable value of land and additions on the property. | Land | Improvement |
|---|---|---|---|---|
| 2025 | $9,425 | $52,000 | $8,738 | $43,262 |
| 2024 | $9,425 | $49,000 | $8,000 | $41,000 |
| 2023 | $9,165 | $49,000 | $8,000 | $41,000 |
| 2022 | $9,165 | $49,000 | $8,000 | $41,000 |
| 2021 | $6,976 | $39,977 | $3,084 | $36,893 |
| 2020 | $6,183 | $39,977 | $3,084 | $36,893 |
| 2019 | $6,034 | $44,918 | $3,084 | $41,834 |
| 2018 | $6,641 | $50,005 | $2,698 | $47,307 |
| 2017 | $5,842 | $50,005 | $2,698 | $47,307 |
| 2016 | $6,284 | $50,005 | $2,698 | $47,307 |
| 2015 | $7,220 | $38,553 | $2,184 | $36,369 |
| 2014 | $6,888 | $38,553 | $2,184 | $36,369 |
| 2013 | $6,895 | $38,553 | $2,184 | $36,369 |
Source: Public Records
Map
Nearby Homes
- 3255 Westview Dr
- 3256 Westview Dr
- 3336 Overland Pass
- 3246 Landwehr Rd Unit 3
- 1594 Portage Run
- 3190 Landwehr Rd
- 4408 Hammersmith Ln
- 3428 Salem Walk
- 3606 Salem Walk
- 3404 Salem Walk
- 2308 Indian Ridge Dr
- 3456 Salem Walk
- 3849 Grace Ln
- 3800 Kiess Dr
- 3820 Kiess Dr
- 1223 Milwaukee Ave
- 3250 Sanders Rd Unit 10C
- 3266 Sanders Rd Unit 6F
- 3240 Brookdale Ln
- 1026 Castilian Ct Unit D162
- 4233 Linden Tree Ln Unit 2
- 4235 Linden Tree Ln Unit 3
- 4237 Linden Tree Ln
- 4225 Linden Tree Ln Unit 8
- 4239 Linden Tree Ln Unit 5
- 4223 Linden Tree Ln
- 4241 Linden Tree Ln Unit 6
- 4221 Linden Tree Ln Unit 6
- 4243 Linden Tree Ln Unit 7
- 4219 Linden Tree Ln Unit 5
- 4234 Linden Tree Ln Unit 1
- 4228 Linden Tree Ln Unit 1
- 4245 Linden Tree Ln
- 4226 Linden Tree Ln Unit 2
- 4217 Linden Tree Ln Unit 4
- 4222 Linden Tree Ln
- 4240 Linden Tree Ln Unit 2
- 4215 Linden Tree Ln
- 4220 Linden Tree Ln
- 4249 Linden Tree Ln Unit 1
Your Personal Tour Guide
Ask me questions while you tour the home.