4231 Wilson Ave Rolling Meadows, IL 60008
Plum Grove Village NeighborhoodEstimated Value: $449,750 - $476,000
3
Beds
3
Baths
1,300
Sq Ft
$352/Sq Ft
Est. Value
About This Home
This home is located at 4231 Wilson Ave, Rolling Meadows, IL 60008 and is currently estimated at $457,188, approximately $351 per square foot. 4231 Wilson Ave is a home located in Cook County with nearby schools including Central Road Elementary School, Galatia Junior High School, and William Fremd High School.
Ownership History
Date
Name
Owned For
Owner Type
Purchase Details
Closed on
Oct 14, 2020
Sold by
Chiantera Rosa
Bought by
Lindholm William H and Lindholm Maria A
Current Estimated Value
Purchase Details
Closed on
Mar 11, 2005
Sold by
Flowers Stella
Bought by
Lindholm William H and Lindholm Maria A
Home Financials for this Owner
Home Financials are based on the most recent Mortgage that was taken out on this home.
Original Mortgage
$239,000
Interest Rate
5.64%
Mortgage Type
Unknown
Purchase Details
Closed on
Dec 19, 2003
Sold by
Flowers A
Bought by
Stella Flowers Trust
Purchase Details
Closed on
Nov 2, 1995
Sold by
American National Bk & Tr Co Of Chicago
Bought by
Flowers Leonard L and Flowers Stella C
Create a Home Valuation Report for This Property
The Home Valuation Report is an in-depth analysis detailing your home's value as well as a comparison with similar homes in the area
Home Values in the Area
Average Home Value in this Area
Purchase History
| Date | Buyer | Sale Price | Title Company |
|---|---|---|---|
| Lindholm William H | -- | Dukane Title Insurance Co | |
| Lindholm William H | $417,500 | Cti | |
| Stella Flowers Trust | -- | -- | |
| Flowers Leonard L | -- | -- |
Source: Public Records
Mortgage History
| Date | Status | Borrower | Loan Amount |
|---|---|---|---|
| Previous Owner | Lindholm William H | $239,000 |
Source: Public Records
Tax History Compared to Growth
Tax History
| Year | Tax Paid | Tax Assessment Tax Assessment Total Assessment is a certain percentage of the fair market value that is determined by local assessors to be the total taxable value of land and additions on the property. | Land | Improvement |
|---|---|---|---|---|
| 2024 | $9,372 | $33,000 | $5,946 | $27,054 |
| 2023 | $8,991 | $33,000 | $5,946 | $27,054 |
| 2022 | $8,991 | $33,000 | $5,946 | $27,054 |
| 2021 | $7,796 | $26,135 | $2,972 | $23,163 |
| 2020 | $7,749 | $26,135 | $2,972 | $23,163 |
| 2019 | $7,734 | $29,007 | $2,972 | $26,035 |
| 2018 | $7,961 | $27,214 | $2,760 | $24,454 |
| 2017 | $7,818 | $27,214 | $2,760 | $24,454 |
| 2016 | $7,545 | $27,214 | $2,760 | $24,454 |
| 2015 | $6,462 | $22,429 | $2,548 | $19,881 |
| 2014 | $6,340 | $22,429 | $2,548 | $19,881 |
| 2013 | $6,165 | $22,429 | $2,548 | $19,881 |
Source: Public Records
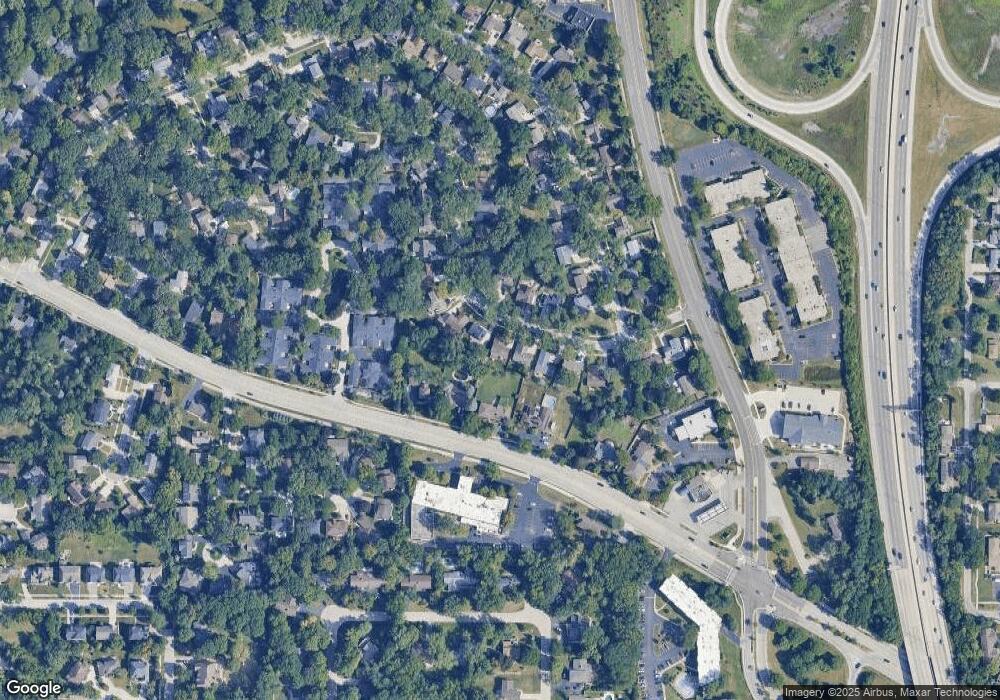
Map
Nearby Homes
- 4301 Euclid Ave
- 2041 Vermont St
- 2600 Brookwood Way Dr Unit 316
- 2600 Brookwood Way Dr Unit 305
- 2600 Brookwood Way Dr Unit 214
- 2600 Brookwood Unit 314
- 2600 Brookwood Way Dr Unit 212
- 4 Eton on Oxford
- 2 Croydon on Duxbury
- 3805 Fairfax Ave
- 4512 Kings Walk Dr Unit 1D
- 160 E Forest Ln
- 2401 Rohlwing Rd
- 4373 Lincoln Ave
- 4602 Euclid Ave Unit 2A
- 1779 California Ave
- 1 Foxcroft on Auburn
- 1808 Plum Grove Rd Unit 1B
- 4941 Emerson Ave
- 200 Edgewood Ln
- 4227 Wilson Ave
- 4235 Wilson Ave
- 4215 Wilson Ave
- 4245 Wilson Ave
- 4300 Kirchoff Rd
- 4320 Kirchoff Rd
- 4238 Wilson Ave
- 4228 Wilson Ave
- 4218 Wilson Ave
- 4207 Wilson Ave
- 4290 Kirchoff Rd
- 4330 Kirchoff Rd
- 4247 Wilson Ave
- 4248 Wilson Ave
- 2215 Adams St
- 4249 Wilson Ave
- 4203 Wilson Ave
- 2201 Adams St
- 4280 Kirchoff Rd
- 4258 Wilson Ave