Estimated Value: $224,000 - $329,000
2
Beds
2
Baths
1,760
Sq Ft
$153/Sq Ft
Est. Value
About This Home
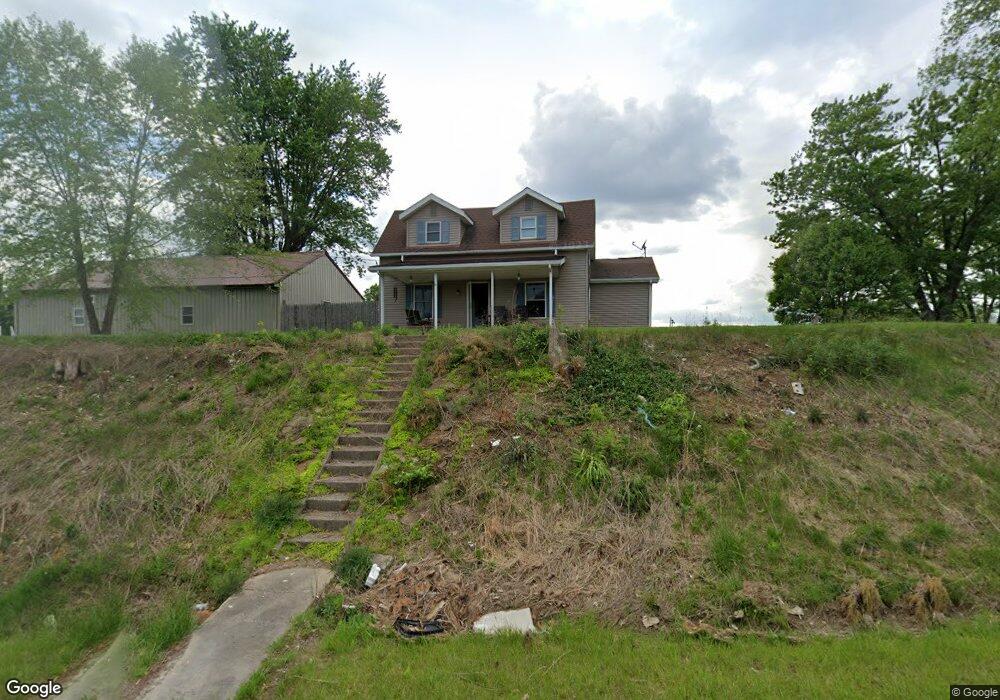
This home is located at 4232 N In-135, Salem, IN 47167 and is currently estimated at $269,305, approximately $153 per square foot. 4232 N In-135 is a home located in Washington County with nearby schools including Bradie M. Shrum Lower Elementary School, Salem Middle School, and Salem High School.
Ownership History
Date
Name
Owned For
Owner Type
Purchase Details
Closed on
May 24, 2017
Sold by
Bowling Don E and Bowling Terry L
Bought by
Bradley Linzie D
Current Estimated Value
Purchase Details
Closed on
Feb 26, 2016
Sold by
Southern Indiana Homes 4U Ltd
Bought by
Bowling Don E and Bowling Terry L
Home Financials for this Owner
Home Financials are based on the most recent Mortgage that was taken out on this home.
Original Mortgage
$115,000
Interest Rate
3.79%
Mortgage Type
New Conventional
Purchase Details
Closed on
Apr 2, 2014
Sold by
Collins Wayne
Bought by
Southern Indiana Homes 4U Ltd
Purchase Details
Closed on
Mar 6, 2008
Sold by
Morris Gene A and Spurgeon Wesle A
Bought by
Benge Margaret A
Home Financials for this Owner
Home Financials are based on the most recent Mortgage that was taken out on this home.
Original Mortgage
$57,600
Interest Rate
5.74%
Mortgage Type
New Conventional
Create a Home Valuation Report for This Property
The Home Valuation Report is an in-depth analysis detailing your home's value as well as a comparison with similar homes in the area
Home Values in the Area
Average Home Value in this Area
Purchase History
| Date | Buyer | Sale Price | Title Company |
|---|---|---|---|
| Bradley Linzie D | $185,000 | Law Offices Of Keith D. Mull, | |
| Bowling Don E | -- | None Available | |
| Southern Indiana Homes 4U Ltd | -- | None Available | |
| Collins Wayne | -- | None Available | |
| Benge Margaret A | -- | None Available |
Source: Public Records
Mortgage History
| Date | Status | Borrower | Loan Amount |
|---|---|---|---|
| Previous Owner | Bowling Don E | $115,000 | |
| Previous Owner | Benge Margaret A | $57,600 |
Source: Public Records
Tax History Compared to Growth
Tax History
| Year | Tax Paid | Tax Assessment Tax Assessment Total Assessment is a certain percentage of the fair market value that is determined by local assessors to be the total taxable value of land and additions on the property. | Land | Improvement |
|---|---|---|---|---|
| 2024 | $1,057 | $130,000 | $19,800 | $110,200 |
| 2023 | $1,222 | $133,600 | $19,800 | $113,800 |
| 2022 | $1,367 | $139,700 | $19,800 | $119,900 |
| 2021 | $1,319 | $126,200 | $19,800 | $106,400 |
| 2020 | $1,126 | $116,900 | $19,800 | $97,100 |
| 2019 | $1,117 | $119,700 | $19,800 | $99,900 |
| 2018 | $1,121 | $118,400 | $19,800 | $98,600 |
| 2017 | $750 | $119,200 | $19,800 | $99,400 |
| 2016 | $384 | $94,600 | $19,800 | $74,800 |
| 2014 | $1,438 | $81,200 | $19,800 | $61,400 |
| 2013 | $1,146 | $108,900 | $19,800 | $89,100 |
Source: Public Records
Map
Nearby Homes
- 3751 N Shell Ln
- 0 W Lake John Hay Rd Unit 202445772
- 128 W Walnut Ridge Rd
- 540 Colony Dr
- W of Rush Creek Rd Unit LotWP001
- 905 Locust St
- off W S Rush Creek Rd
- 501 E Homer St
- 808 Locust St
- 2535 E Nathans Run
- 800 Hayes Ave
- 801 N College Ave
- 207 Southern Ave
- 115 Nichols Ave
- 100 Walnut Tree Dr
- 404 E Mulberry St
- 0 W Mulberry St
- 406 W Mulberry St
- 213 Washington Blvd
- 303 W Market St
- 4232 N State Road 135
- 4232 N State Road 135
- 4308 N State Road 135
- 4322 N State Road 135
- 4239 N State Road 135
- 4420 N Hypes Rd
- 4440 N Hypes Rd
- 148 W Pump Station Rd
- 64 W Pump Station Rd
- 224 W Pump Station Rd
- 294 E Delaney Park Rd
- 4490 N Hypes Rd
- 3860 N Jeanette Rd
- 4534 N Hypes Rd
- 520 W Pump Station Rd
- 3951 N Cooley Ln
- 3925 N Cooley Ln
- 473 W Pump Station Rd
- 993 E Delaney Park Rd
- 630 W Pump Station Rd