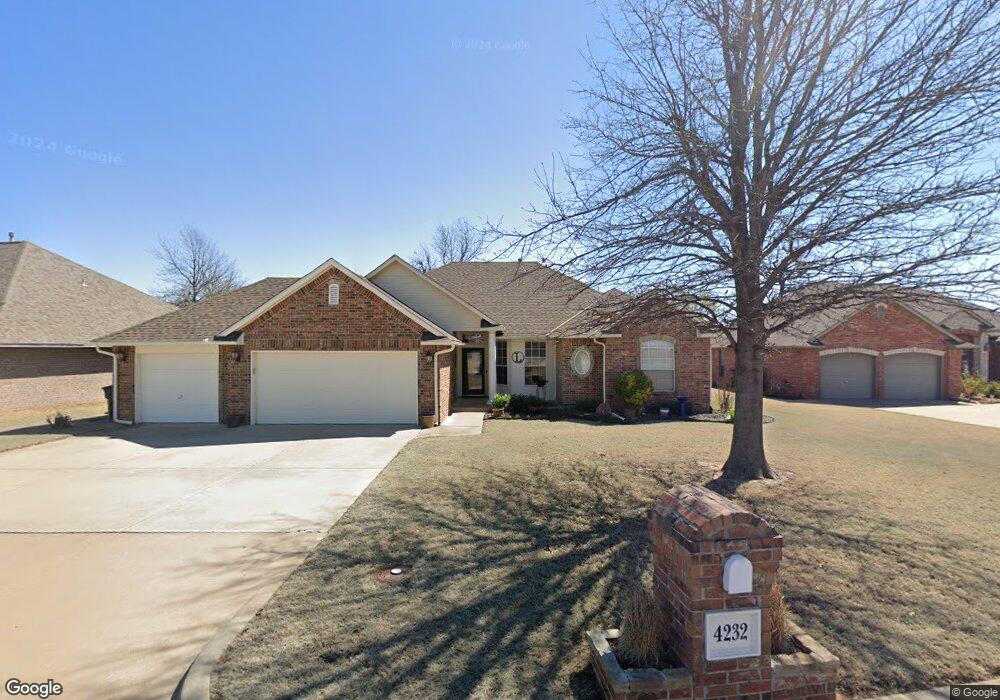
4232 Oakbrook Dr Oklahoma City, OK 73115
Estimated Value: $230,000 - $263,000
3
Beds
2
Baths
1,968
Sq Ft
$127/Sq Ft
Est. Value
About This Home
This home is located at 4232 Oakbrook Dr, Oklahoma City, OK 73115 and is currently estimated at $250,778, approximately $127 per square foot. 4232 Oakbrook Dr is a home located in Oklahoma County with nearby schools including Townsend Elementary School, Kerr Middle School, and Del City High School.
Ownership History
Date
Name
Owned For
Owner Type
Purchase Details
Closed on
Jan 20, 2021
Sold by
Lee Nelda L
Bought by
Lee Nelda L and Alston Nicole D
Current Estimated Value
Purchase Details
Closed on
Jun 28, 2004
Sold by
Sun Contracting Llc
Bought by
Lee Michael O and Lee Nelda L
Purchase Details
Closed on
Dec 19, 2003
Sold by
The Horizon Group Llc
Bought by
Sun Contracting Llc
Purchase Details
Closed on
Dec 18, 2003
Sold by
Earhart Investments Llc
Bought by
Earhart Investments Llc
Create a Home Valuation Report for This Property
The Home Valuation Report is an in-depth analysis detailing your home's value as well as a comparison with similar homes in the area
Home Values in the Area
Average Home Value in this Area
Purchase History
| Date | Buyer | Sale Price | Title Company |
|---|---|---|---|
| Lee Nelda L | -- | None Listed On Document | |
| Lee Michael O | $161,000 | Capitol Abstract & Title | |
| Sun Contracting Llc | -- | -- | |
| Earhart Investments Llc | -- | -- | |
| The Horizon Group Llc | -- | -- |
Source: Public Records
Tax History Compared to Growth
Tax History
| Year | Tax Paid | Tax Assessment Tax Assessment Total Assessment is a certain percentage of the fair market value that is determined by local assessors to be the total taxable value of land and additions on the property. | Land | Improvement |
|---|---|---|---|---|
| 2024 | $2,040 | $19,140 | $2,711 | $16,429 |
| 2023 | $2,040 | $19,140 | $2,969 | $16,171 |
| 2022 | $2,009 | $19,140 | $3,422 | $15,718 |
| 2021 | $2,081 | $19,140 | $3,806 | $15,334 |
| 2020 | $2,136 | $19,140 | $3,537 | $15,603 |
| 2019 | $2,071 | $19,140 | $3,546 | $15,594 |
| 2018 | $2,100 | $19,140 | $0 | $0 |
| 2017 | $2,115 | $19,139 | $3,740 | $15,399 |
| 2016 | $2,135 | $18,808 | $2,951 | $15,857 |
| 2015 | $2,081 | $18,260 | $2,960 | $15,300 |
| 2014 | $2,045 | $18,005 | $2,960 | $15,045 |
Source: Public Records
Map
Nearby Homes
- 4729 SE 43rd St
- 4732 Princess Ln
- 5225 SE 45th Terrace
- 4625 SE 42nd St
- 4113 Vickie Dr
- 4613 SE 41st St
- 4853 Montclair Dr
- 4728 SE 45th St
- 3500 Del View Dr
- 3413 Del View Dr
- 4704 Tempo Dr
- 4205 Epperly Dr
- 4709 SE 47th St
- 4428 SE 39th St
- 5024 Cinder Dr
- 4428 SE 38th St
- 4540 SE 35th St
- 3128 Del View Dr
- 5309 Eden Dr
- 4809 Elmview Dr
- 4220 Oakbrook Dr
- 4216 Oakbrook Dr
- 4213 Oakbrook Dr
- 4224 Oakbrook Dr
- 4217 Oakbrook Dr
- 4209 Oakbrook Dr
- 4221 Oakbrook Dr
- 4208 Oakbrook Dr
- 4228 Oakbrook Dr
- 4205 Oakbrook Dr
- 4229 Lamar Dr
- 4233 Lamar Dr
- 4208 Angela Dr
- 4204 Oakbrook Dr
- 4225 Lamar Dr
- 4225 Oakbrook Dr
- 4204 Angela Dr
- 4221 Lamar Dr
- 4216 Angela Dr
- 4213 Lamar Dr