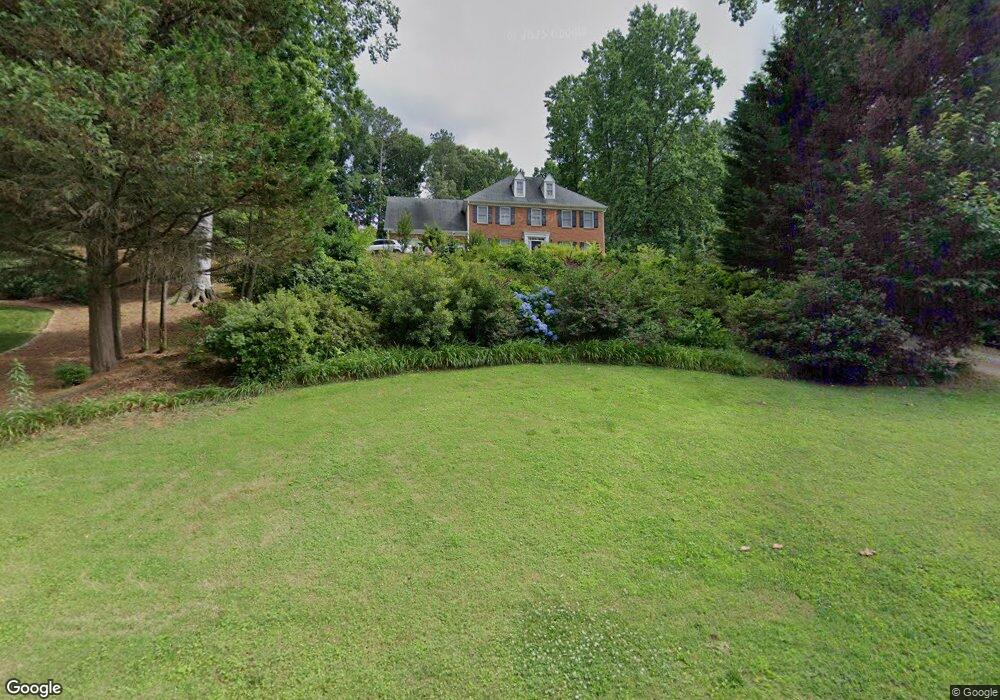
4232 Singing Post Ln NE Unit 5 Roswell, GA 30075
East Cobb NeighborhoodEstimated Value: $642,000 - $720,000
4
Beds
3
Baths
3,011
Sq Ft
$225/Sq Ft
Est. Value
About This Home
This home is located at 4232 Singing Post Ln NE Unit 5, Roswell, GA 30075 and is currently estimated at $677,686, approximately $225 per square foot. 4232 Singing Post Ln NE Unit 5 is a home located in Cobb County with nearby schools including Shallowford Falls Elementary School, Simpson Middle School, and Lassiter High School.
Ownership History
Date
Name
Owned For
Owner Type
Purchase Details
Closed on
Nov 6, 2017
Sold by
Grasinger I Samuel Charles I
Bought by
Grasinger Samuel Charles and Grasinger Judith S
Current Estimated Value
Home Financials for this Owner
Home Financials are based on the most recent Mortgage that was taken out on this home.
Original Mortgage
$228,500
Outstanding Balance
$191,015
Interest Rate
3.85%
Mortgage Type
New Conventional
Estimated Equity
$486,671
Purchase Details
Closed on
Oct 17, 1996
Sold by
Sunder Ashwath N Majorie
Bought by
Grasinger Samuel Judith S
Purchase Details
Closed on
Apr 28, 1995
Sold by
Armstrong Charles H Ann
Bought by
Sunder Ashwath N
Purchase Details
Closed on
Sep 30, 1993
Sold by
Jerrum Jill
Bought by
Armstrong Charles H Anne E
Home Financials for this Owner
Home Financials are based on the most recent Mortgage that was taken out on this home.
Original Mortgage
$100,000
Interest Rate
6.9%
Create a Home Valuation Report for This Property
The Home Valuation Report is an in-depth analysis detailing your home's value as well as a comparison with similar homes in the area
Home Values in the Area
Average Home Value in this Area
Purchase History
| Date | Buyer | Sale Price | Title Company |
|---|---|---|---|
| Grasinger Samuel Charles | -- | -- | |
| Grasinger Samuel Judith S | $183,000 | -- | |
| Sunder Ashwath N | $185,000 | -- | |
| Armstrong Charles H Anne E | $163,000 | -- |
Source: Public Records
Mortgage History
| Date | Status | Borrower | Loan Amount |
|---|---|---|---|
| Open | Grasinger Samuel Charles | $228,500 | |
| Previous Owner | Armstrong Charles H Anne E | $100,000 | |
| Closed | Sunder Ashwath N | $0 |
Source: Public Records
Tax History Compared to Growth
Tax History
| Year | Tax Paid | Tax Assessment Tax Assessment Total Assessment is a certain percentage of the fair market value that is determined by local assessors to be the total taxable value of land and additions on the property. | Land | Improvement |
|---|---|---|---|---|
| 2025 | $1,401 | $264,992 | $52,000 | $212,992 |
| 2024 | $1,406 | $264,992 | $52,000 | $212,992 |
| 2023 | $1,067 | $220,428 | $40,800 | $179,628 |
| 2022 | $1,216 | $201,392 | $40,800 | $160,592 |
| 2021 | $1,137 | $174,884 | $38,800 | $136,084 |
| 2020 | $1,137 | $174,884 | $38,800 | $136,084 |
| 2019 | $1,098 | $161,732 | $33,600 | $128,132 |
| 2018 | $1,098 | $161,732 | $33,600 | $128,132 |
| 2017 | $949 | $148,228 | $33,600 | $114,628 |
| 2016 | $3,569 | $148,228 | $33,600 | $114,628 |
| 2015 | $3,013 | $120,192 | $34,800 | $85,392 |
| 2014 | $3,033 | $120,192 | $0 | $0 |
Source: Public Records
Map
Nearby Homes
- 4319 Summit Oaks Ln NE
- 4220 Singing Post Ln NE
- 3402 Johnson Ferry Rd NE
- 4505 Bastion Dr
- 4509 Bastion Dr
- 3760 Loch Highland Pkwy NE
- 4146 Chimney Lake Dr NE
- 3453 Drayton Dr NE
- 3645 Lassiter Rd
- 3810 Galloway Dr NE
- 4520 Huntridge Dr NE
- 4149 Barberry Dr NE
- 3865 Mabry Rd NE
- 4680 Cambridge Approach Cir NE
- 4150 Chimney Heights NE
- 3968 Rock Mill Dr
- 3277 Artessa Ln NE
- 4230 Singing Post Ln NE
- 4234 Singing Post Ln NE
- 4228 Singing Post Ln NE
- 4236 Singing Post Ln NE Unit 5
- 3645 Summit Oaks Dr NE
- 4238 Singing Post Ln NE Unit 5
- 4233 Singing Post Ln NE
- 4231 Singing Post Ln NE
- 3649 Summit Oaks Dr NE
- 3641 Summit Oaks Dr NE
- 3653 Summit Oaks Dr NE
- 4237 Singing Post Ln NE
- 4229 Singing Post Ln NE Unit 5
- 4327 Summit Oaks Ln NE Unit 30
- 4327 Summit Oaks Ln NE
- 4240 Singing Post Ln NE
- 4331 Summit Oaks Ln NE
- 3657 Summit Oaks Dr NE
- 4258 Shipyard Trace NE
- 4227 Singing Post Ln NE