Estimated Value: $503,000 - $1,115,000
4
Beds
5
Baths
3,617
Sq Ft
$206/Sq Ft
Est. Value
About This Home
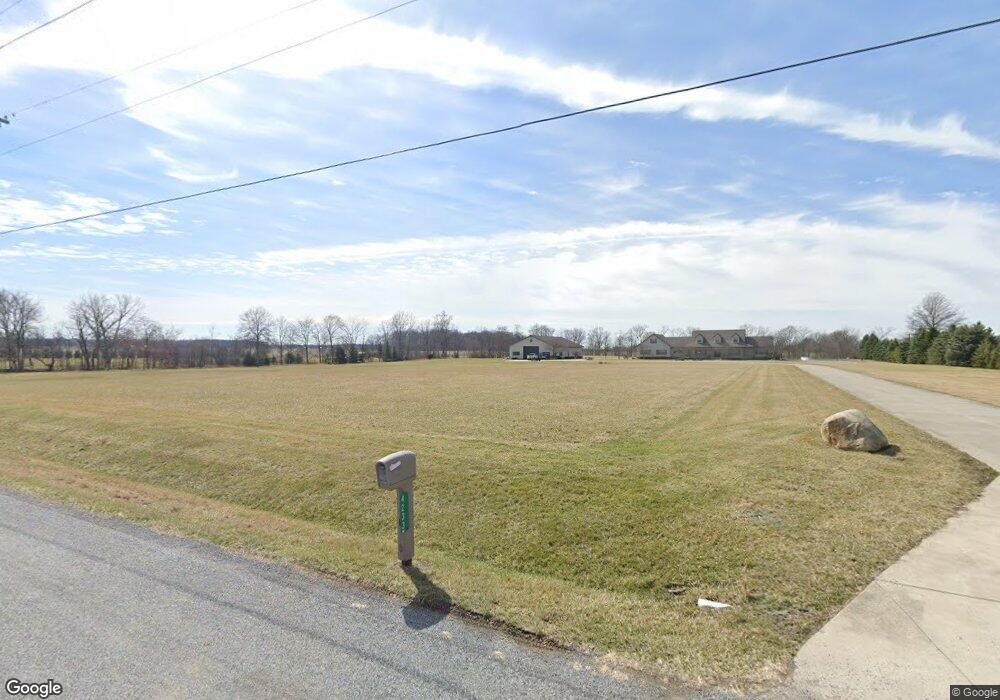
This home is located at 4233 N Cool Rd, Lima, OH 45801 and is currently estimated at $746,571, approximately $206 per square foot. 4233 N Cool Rd is a home located in Allen County with nearby schools including Bath Elementary School, Bath Middle School, and Bath High School.
Ownership History
Date
Name
Owned For
Owner Type
Purchase Details
Closed on
Apr 27, 2016
Sold by
Vanwamnnig Glendoris L
Bought by
Burkholder Troy M
Current Estimated Value
Home Financials for this Owner
Home Financials are based on the most recent Mortgage that was taken out on this home.
Original Mortgage
$599,395
Outstanding Balance
$478,245
Interest Rate
3.73%
Mortgage Type
Purchase Money Mortgage
Estimated Equity
$268,326
Purchase Details
Closed on
Dec 27, 2013
Sold by
Burkholder Donna J
Bought by
Burkholder Troy M
Purchase Details
Closed on
Jun 19, 2012
Sold by
Burkholder Craig D
Bought by
Burkholder Troy M
Purchase Details
Closed on
May 24, 1989
Bought by
Burkholder Craig D
Create a Home Valuation Report for This Property
The Home Valuation Report is an in-depth analysis detailing your home's value as well as a comparison with similar homes in the area
Home Values in the Area
Average Home Value in this Area
Purchase History
| Date | Buyer | Sale Price | Title Company |
|---|---|---|---|
| Burkholder Troy M | $607,500 | None Available | |
| Burkholder Troy M | -- | None Available | |
| Burkholder Troy M | -- | Attorney | |
| Burkholder Craig D | $20,000 | -- |
Source: Public Records
Mortgage History
| Date | Status | Borrower | Loan Amount |
|---|---|---|---|
| Open | Burkholder Troy M | $599,395 |
Source: Public Records
Tax History Compared to Growth
Tax History
| Year | Tax Paid | Tax Assessment Tax Assessment Total Assessment is a certain percentage of the fair market value that is determined by local assessors to be the total taxable value of land and additions on the property. | Land | Improvement |
|---|---|---|---|---|
| 2024 | $7,543 | $181,130 | $29,400 | $151,730 |
| 2023 | $6,501 | $153,510 | $24,920 | $128,590 |
| 2022 | $6,566 | $153,510 | $24,920 | $128,590 |
| 2021 | $6,604 | $153,510 | $24,920 | $128,590 |
| 2020 | $5,639 | $119,640 | $25,800 | $93,840 |
| 2019 | $5,639 | $119,640 | $25,800 | $93,840 |
| 2018 | $5,623 | $119,640 | $25,800 | $93,840 |
| 2017 | $5,090 | $106,550 | $24,960 | $81,590 |
| 2016 | $5,013 | $106,550 | $24,960 | $81,590 |
| 2015 | $5,272 | $106,510 | $24,920 | $81,590 |
| 2014 | $5,419 | $105,210 | $19,250 | $85,960 |
| 2013 | $5,960 | $105,210 | $19,250 | $85,960 |
Source: Public Records
Map
Nearby Homes
- 4619 N Thayer Rd
- 6476 Mickelson Ln
- 000 Napoleon Rd
- 0 N Dixie Hwy Unit 308796
- 0 N Dixie Hwy Unit 300253
- 5025 N Cool Rd
- 5496 Sandusky Rd
- 4700 Herr Rd
- 207 W Prospect St
- 108 E Main St
- 108 Highland Lakes Dr
- 6601 N Napoleon Rd
- 2327 N Phillips Rd
- 663 N Mcclure Rd
- 647 Fisher Rd
- 118 E Main St
- 000 Lincoln Hwy
- 3252 Stewart Rd
- 9290 Lincoln Hwy
- 1679 E Bluelick Rd