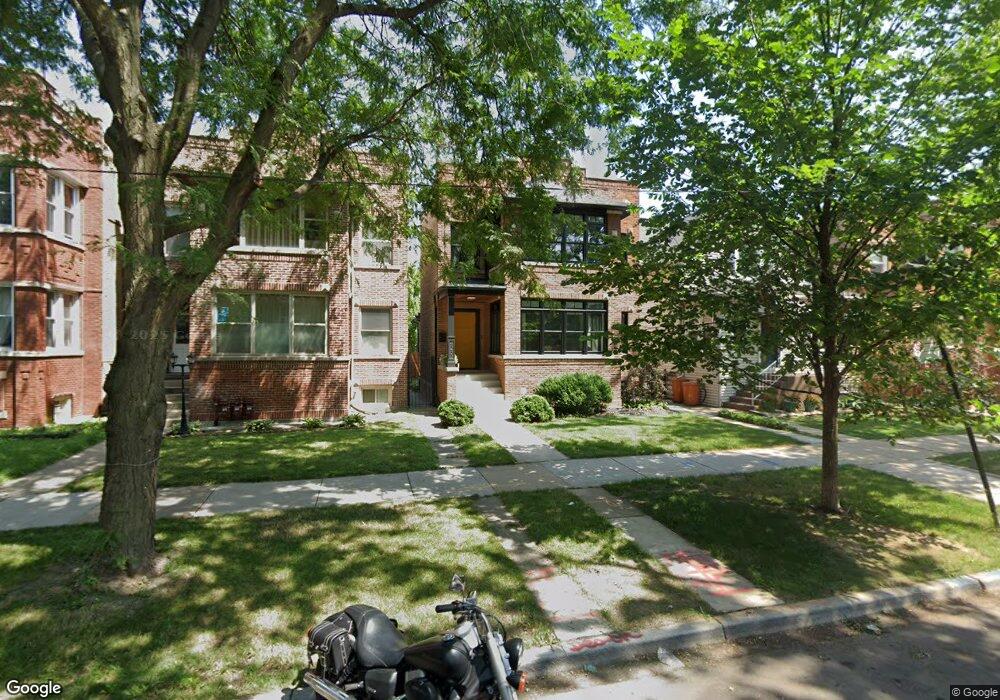
4233 N Spaulding Ave Chicago, IL 60618
Irving Park NeighborhoodEstimated Value: $979,000 - $1,171,000
About This Home
This home is located at 4233 N Spaulding Ave, Chicago, IL 60618 and is currently estimated at $1,079,055, approximately $375 per square foot. 4233 N Spaulding Ave is a home located in Cook County with nearby schools including Bateman Elementary School, Roosevelt High School, and CICS Irving Park.
Ownership History
We collect this data history from publicly available records. To have your information removed, we recommend requesting removal directly through your county’s website.
Purchase Details
Purchase Details
Home Financials for this Owner
Home Financials are based on the most recent Mortgage that was taken out on this home.Purchase Details
Home Financials for this Owner
Home Financials are based on the most recent Mortgage that was taken out on this home.Purchase Details
Home Values in the Area
Average Home Value in this Area
Purchase History
We collect this data history from publicly available records. To have your information removed, we recommend requesting removal directly through your county’s website.
| Date | Buyer | Sale Price | Title Company |
|---|---|---|---|
| $1,030,000 | Chicago Title | ||
| $915,000 | Fidelity National Title | ||
| $330,000 | Baird & Warmer Title Service | ||
| -- | -- |
Mortgage History
We collect this data history from publicly available records. To have your information removed, we recommend requesting removal directly through your county’s website.
| Date | Status | Borrower | Loan Amount |
|---|---|---|---|
| Previous Owner | $713,700 | ||
| Previous Owner | $313,500 |
Tax History
We collect this data history from publicly available records. To have your information removed, we recommend requesting removal directly through your county’s website.
| Year | Tax Paid | Tax Assessment Tax Assessment Total Assessment is a certain percentage of the fair market value that is determined by local assessors to be the total taxable value of land and additions on the property. | Land | Improvement |
|---|---|---|---|---|
| 2025 | $18,633 | $91,000 | $23,250 | $67,750 |
| 2024 | $18,633 | $91,000 | $23,250 | $67,750 |
| 2023 | $18,164 | $88,000 | $18,750 | $69,250 |
| 2022 | $18,164 | $88,000 | $18,750 | $69,250 |
| 2021 | $17,082 | $88,000 | $18,750 | $69,250 |
| 2020 | $9,986 | $47,775 | $8,250 | $39,525 |
| 2019 | $10,010 | $53,084 | $8,250 | $44,834 |
| 2018 | $11,565 | $61,793 | $8,250 | $53,543 |
| 2017 | $8,321 | $41,902 | $7,500 | $34,402 |
| 2016 | $1,959 | $9,999 | $7,500 | $2,499 |
| 2015 | $5,492 | $32,488 | $7,500 | $24,988 |
| 2014 | $4,398 | $26,184 | $6,750 | $19,434 |
| 2013 | $4,733 | $28,557 | $6,750 | $21,807 |
Map
- 3335 W Berteau Ave
- 4344 N Spaulding Ave Unit 1
- 4224 N Kimball Ave
- 3312 W Belle Plaine Ave Unit 4
- 3354 W Pensacola Ave
- 3124 W Cullom Ave Unit 1
- 4438 N Kedzie Ave Unit G-1
- 4421 N Troy St
- 4036 N Bernard St
- 3941 N Spaulding Ave
- 4136 N Sacramento Ave
- 4535 N Spaulding Ave
- 4519 N Troy St
- 3559 W Montrose Ave Unit 3E
- 4500 N Saint Louis Ave
- 3550 W Montrose Ave Unit 406
- 3951 N Saint Louis Ave Unit 1
- 4409 N Sacramento Ave Unit G
- 2934 W Montrose Ave Unit 303
- 4131 N Richmond St
- 4233 N Spaulding Ave
- 4231 N Spaulding Ave
- 4231 N Spaulding Ave Unit 1
- 4231 N Spaulding Ave
- 4237 N Spaulding Ave
- 4237 N Spaulding Ave
- 4239 N Spaulding Ave
- 4239 N Spaulding Ave
- 4227 N Spaulding Ave Unit 2
- 4227 N Spaulding Ave
- 4243 N Spaulding Ave
- 4225 N Spaulding Ave
- 4221 N Spaulding Ave Unit 2
- 4245 N Spaulding Ave
- 4245 N Spaulding Ave Unit 1
- 4219 N Spaulding Ave
- 4249 N Spaulding Ave Unit 1
- 4230 N Sawyer Ave Unit 2
- 4232 N Sawyer Ave
- 4236 N Spaulding Ave Unit 3
Ask me questions while you tour the home.