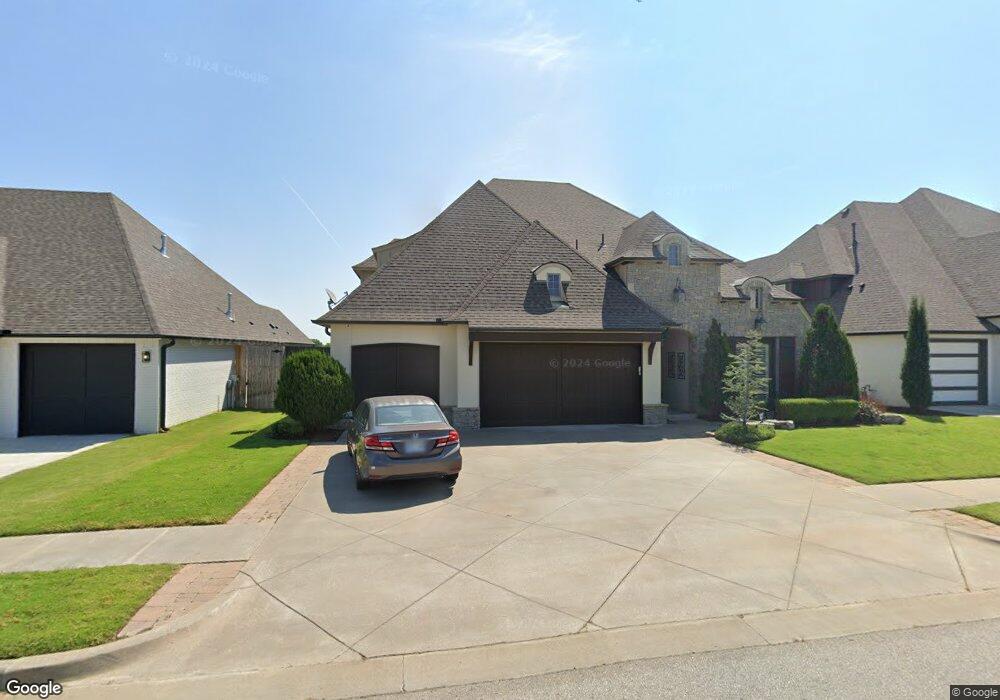
4233 S 173rd East Ave Tulsa, OK 74134
Lynn Lane NeighborhoodEstimated Value: $616,000 - $706,817
4
Beds
4
Baths
3,862
Sq Ft
$172/Sq Ft
Est. Value
About This Home
This home is located at 4233 S 173rd East Ave, Tulsa, OK 74134 and is currently estimated at $664,954, approximately $172 per square foot. 4233 S 173rd East Ave is a home located in Tulsa County with nearby schools including Country Lane Primary Elementary School, Country Lane Intermediate School, and Centennial Middle School.
Ownership History
Date
Name
Owned For
Owner Type
Purchase Details
Closed on
Apr 25, 2025
Sold by
Boekeloo Linda J and Boekeloo David P
Bought by
Boekeloo David P and Boekeloo Linda J
Current Estimated Value
Home Financials for this Owner
Home Financials are based on the most recent Mortgage that was taken out on this home.
Original Mortgage
$689,000
Interest Rate
6.81%
Mortgage Type
VA
Purchase Details
Closed on
Mar 17, 2023
Sold by
Craig Michael Mann Revocable Living Trus
Bought by
Boekeloo Linda J and Boekeloo David P
Purchase Details
Closed on
Apr 22, 2016
Sold by
Mann Craig and Mann Cherie L
Bought by
The Craig Michael Mann Revocable Living
Purchase Details
Closed on
Feb 1, 2016
Sold by
Chris Burton Homes Llc
Bought by
Mann Craig and Mann Cherie L
Create a Home Valuation Report for This Property
The Home Valuation Report is an in-depth analysis detailing your home's value as well as a comparison with similar homes in the area
Home Values in the Area
Average Home Value in this Area
Purchase History
| Date | Buyer | Sale Price | Title Company |
|---|---|---|---|
| Boekeloo David P | -- | Orange Coast Lender Services | |
| Boekeloo Linda J | $659,000 | Fidelity National Title | |
| The Craig Michael Mann Revocable Living | -- | None Available | |
| Mann Craig | $450,000 | Tulsa Abstract & Title |
Source: Public Records
Mortgage History
| Date | Status | Borrower | Loan Amount |
|---|---|---|---|
| Previous Owner | Boekeloo David P | $689,000 |
Source: Public Records
Tax History Compared to Growth
Tax History
| Year | Tax Paid | Tax Assessment Tax Assessment Total Assessment is a certain percentage of the fair market value that is determined by local assessors to be the total taxable value of land and additions on the property. | Land | Improvement |
|---|---|---|---|---|
| 2024 | $6,685 | $59,787 | $7,410 | $52,377 |
| 2023 | $6,685 | $53,507 | $6,221 | $47,286 |
| 2022 | $6,761 | $50,948 | $7,389 | $43,559 |
| 2021 | $6,628 | $49,435 | $7,170 | $42,265 |
| 2020 | $6,601 | $49,435 | $7,170 | $42,265 |
| 2019 | $6,846 | $49,435 | $7,170 | $42,265 |
| 2018 | $6,897 | $50,435 | $7,315 | $43,120 |
| 2017 | $6,882 | $50,435 | $7,315 | $43,120 |
| 2016 | $3,760 | $27,858 | $7,315 | $0 |
| 2015 | $1 | $576 | $576 | $0 |
Source: Public Records
Map
Nearby Homes
- 17508 E 43rd Place
- 4466 S 173rd Ave E
- 17065 E 45th St
- 17621 E 44th Place
- 17520 E 45th St
- 4472 S 169th East Ave
- 16804 E 43rd St S
- 17246 E 45th Place
- 17812 E 45th Place S
- Brenda Plan at Huntington Park II
- Walker ll Plan at Huntington Park II
- Dorsey IV Plan at Huntington Park II
- Hampton III Plan at Huntington Park II
- Lee II Plan at Huntington Park II
- Dorsey Farm House Plan at Huntington Park II
- Brenda MG Plan at Huntington Park II
- Ridgway III Plan at Huntington Park II
- Ashville Plan at Huntington Park II
- Oak Plan at Huntington Park II
- Ashville AE Plan at Huntington Park II
- 4233 S 173rd East Ave
- 4201 S 173rd Ave E
- 4201 S 173rd East Ave
- 4249 S 173rd East Ave
- 4255 S 173rd Ave E
- 4255 S 173rd East Ave
- 4197 S 173rd East Ave
- 17184 E 42nd St
- 17291 E 42nd Place
- 4189 S 173rd East Ave
- 4263 S 173rd East Ave
- 4263 S 173rd Ave E
- 17176 E 42nd St
- 17265 E 42nd Place
- 17185 E 42nd St
- 17403 E 43rd St
- 4167 S 173rd Ave E
- 4167 S 173rd East Ave
- 4275 S 173rd East Ave
- 17288 E 42nd Place