Estimated Value: $372,000 - $450,000
6
Beds
3
Baths
2,796
Sq Ft
$147/Sq Ft
Est. Value
About This Home
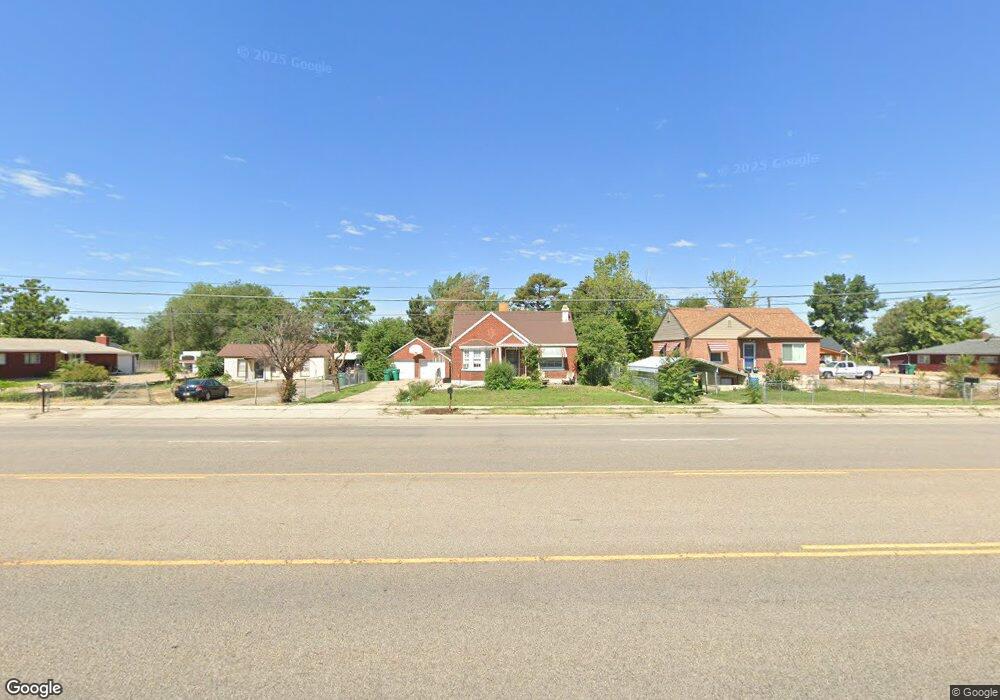
This home is located at 4233 S 1900 W, Roy, UT 84067 and is currently estimated at $410,749, approximately $146 per square foot. 4233 S 1900 W is a home located in Weber County with nearby schools including North Park School, Sand Ridge Junior High School, and Roy High School.
Ownership History
Date
Name
Owned For
Owner Type
Purchase Details
Closed on
Jan 16, 2014
Sold by
Beck Robert
Bought by
Beck Robert Horst
Current Estimated Value
Purchase Details
Closed on
Dec 17, 2012
Sold by
Beck Arlene B
Bought by
Beck Robert
Purchase Details
Closed on
Oct 6, 1999
Sold by
Crookston Mark B
Bought by
Beck Robert and Beck Arlene B
Purchase Details
Closed on
Aug 11, 1998
Sold by
Montgomery Annette E and Montgomery Ulusses S
Bought by
Montgomery Annette E
Purchase Details
Closed on
May 2, 1997
Sold by
Montgomery Annette E
Bought by
Montgomery Annette E and Montgomery Ulysses S
Home Financials for this Owner
Home Financials are based on the most recent Mortgage that was taken out on this home.
Original Mortgage
$88,000
Interest Rate
10.5%
Purchase Details
Closed on
Feb 15, 1996
Sold by
Saunders Carl R
Bought by
Montgomery Annette E
Home Financials for this Owner
Home Financials are based on the most recent Mortgage that was taken out on this home.
Original Mortgage
$64,500
Interest Rate
7.1%
Mortgage Type
Seller Take Back
Create a Home Valuation Report for This Property
The Home Valuation Report is an in-depth analysis detailing your home's value as well as a comparison with similar homes in the area
Home Values in the Area
Average Home Value in this Area
Purchase History
| Date | Buyer | Sale Price | Title Company |
|---|---|---|---|
| Beck Robert Horst | -- | None Available | |
| Beck Robert | -- | None Available | |
| Beck Robert | -- | -- | |
| Montgomery Annette E | -- | -- | |
| Montgomery Annette E | -- | -- | |
| Montgomery Annette E | -- | Bonneville Title |
Source: Public Records
Mortgage History
| Date | Status | Borrower | Loan Amount |
|---|---|---|---|
| Previous Owner | Montgomery Annette E | $88,000 | |
| Previous Owner | Montgomery Annette E | $64,500 |
Source: Public Records
Tax History
| Year | Tax Paid | Tax Assessment Tax Assessment Total Assessment is a certain percentage of the fair market value that is determined by local assessors to be the total taxable value of land and additions on the property. | Land | Improvement |
|---|---|---|---|---|
| 2025 | $2,557 | $403,117 | $110,744 | $292,373 |
| 2024 | $2,494 | $395,999 | $110,757 | $285,242 |
| 2023 | $2,330 | $369,000 | $100,844 | $268,156 |
| 2022 | $2,326 | $379,000 | $87,171 | $291,829 |
| 2021 | $1,956 | $288,000 | $61,399 | $226,601 |
| 2020 | $1,874 | $254,000 | $61,399 | $192,601 |
| 2019 | $1,755 | $223,000 | $36,052 | $186,948 |
| 2018 | $1,689 | $202,001 | $33,462 | $168,539 |
| 2017 | $1,560 | $174,000 | $33,462 | $140,538 |
| 2016 | $1,405 | $83,378 | $15,648 | $67,730 |
| 2015 | $1,366 | $83,378 | $15,648 | $67,730 |
| 2014 | $1,378 | $83,378 | $15,648 | $67,730 |
Source: Public Records
Map
Nearby Homes
- 2015 W 4225 S
- 4220 S 2075 W
- 4328 S 2175 W
- 2015 W 4450 S
- 1959 3985 St S Unit 2
- 4061 S 2175 W
- 4047 S 2175 W
- 1910 W 3920 S
- 3923 S 1975 W Unit 15
- 1940 W 3920 S
- 4642 S 1900 W Unit 41
- 2038 W 4600 S
- 3800 S 1900 W Unit 196
- 3800 S 1900 W Unit 257
- 3800 S 1900 W Unit 248
- 3800 S 1900 W Unit 111
- 3800 S 1900 W Unit 144
- 3800 S 1900 W Unit 28
- 3800 S 1900 W Unit 66
- 3800 S 1900 W Unit 163
Your Personal Tour Guide
Ask me questions while you tour the home.