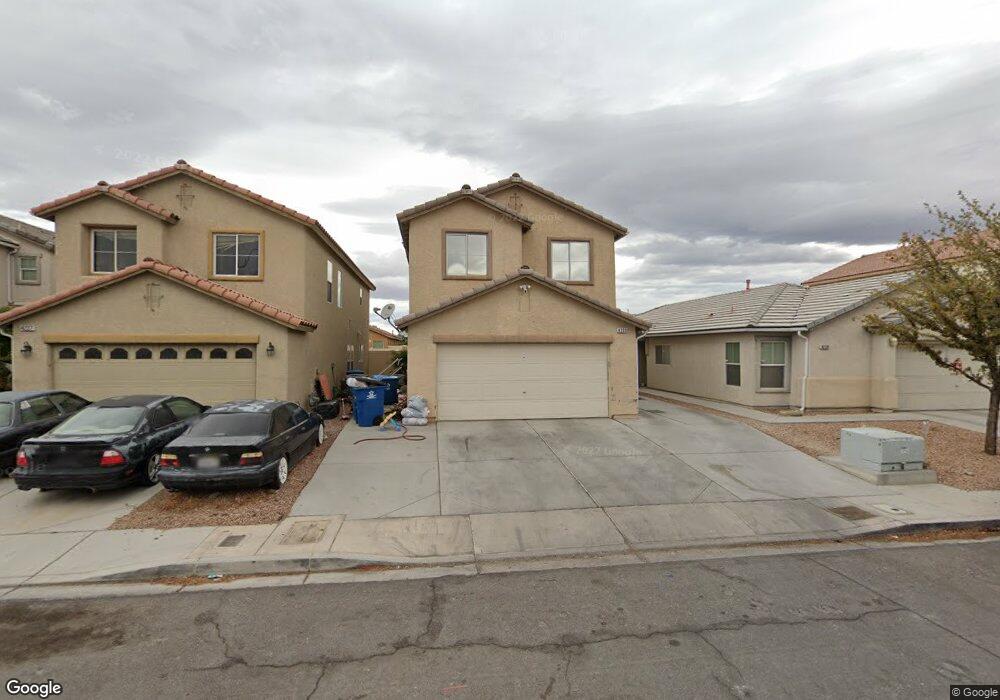
4233 Walnut Family Ct Las Vegas, NV 89115
Estimated Value: $373,000 - $417,000
4
Beds
3
Baths
2,039
Sq Ft
$192/Sq Ft
Est. Value
About This Home
This home is located at 4233 Walnut Family Ct, Las Vegas, NV 89115 and is currently estimated at $390,942, approximately $191 per square foot. 4233 Walnut Family Ct is a home located in Clark County with nearby schools including Gwendolyn Woolley Elementary School, Clyde C. Cox Elementary School, and Marvin M Sedway Middle School.
Ownership History
Date
Name
Owned For
Owner Type
Purchase Details
Closed on
Dec 1, 2017
Sold by
Barrane Erica
Bought by
Arreola Sosa Ignacio Manuel
Current Estimated Value
Home Financials for this Owner
Home Financials are based on the most recent Mortgage that was taken out on this home.
Original Mortgage
$191,468
Outstanding Balance
$163,473
Interest Rate
4.5%
Mortgage Type
FHA
Estimated Equity
$227,469
Purchase Details
Closed on
Nov 15, 2017
Sold by
Cordova Angelica
Bought by
Arreloa Sosa Ingnacio Manuel
Home Financials for this Owner
Home Financials are based on the most recent Mortgage that was taken out on this home.
Original Mortgage
$191,468
Outstanding Balance
$163,473
Interest Rate
4.5%
Mortgage Type
FHA
Estimated Equity
$227,469
Purchase Details
Closed on
Dec 15, 2016
Sold by
Cordova Angelica
Bought by
Cordova Angelica
Home Financials for this Owner
Home Financials are based on the most recent Mortgage that was taken out on this home.
Original Mortgage
$123,900
Interest Rate
3.54%
Mortgage Type
New Conventional
Purchase Details
Closed on
Dec 14, 2015
Sold by
Grierson Steven D
Bought by
Cordova Angelica
Purchase Details
Closed on
Dec 30, 2010
Sold by
Fannie Mae
Bought by
Valdez Hector
Home Financials for this Owner
Home Financials are based on the most recent Mortgage that was taken out on this home.
Original Mortgage
$96,490
Interest Rate
4.34%
Mortgage Type
FHA
Purchase Details
Closed on
Dec 28, 2010
Sold by
Cordova Bilchis Angelica
Bought by
Valdez Hector
Home Financials for this Owner
Home Financials are based on the most recent Mortgage that was taken out on this home.
Original Mortgage
$96,490
Interest Rate
4.34%
Mortgage Type
FHA
Purchase Details
Closed on
Apr 26, 2010
Sold by
Nguyen Mary Dung and Ormord Joseph W
Bought by
Federal National Mortgage Association
Purchase Details
Closed on
Oct 6, 2004
Sold by
Nguyen Mary Dung
Bought by
Ormord Joseph W and Nguyen Mary Dung
Home Financials for this Owner
Home Financials are based on the most recent Mortgage that was taken out on this home.
Original Mortgage
$193,600
Interest Rate
3.87%
Mortgage Type
New Conventional
Purchase Details
Closed on
Nov 6, 2003
Sold by
Ormord Joseph William
Bought by
Nguyen Mary Dung
Home Financials for this Owner
Home Financials are based on the most recent Mortgage that was taken out on this home.
Original Mortgage
$146,200
Interest Rate
5.72%
Mortgage Type
Unknown
Create a Home Valuation Report for This Property
The Home Valuation Report is an in-depth analysis detailing your home's value as well as a comparison with similar homes in the area
Home Values in the Area
Average Home Value in this Area
Purchase History
| Date | Buyer | Sale Price | Title Company |
|---|---|---|---|
| Arreola Sosa Ignacio Manuel | -- | Chicago Title Of Nevada C | |
| Arreloa Sosa Ingnacio Manuel | $197,000 | Chicago Title Of Nevada | |
| Cordova Angelica | -- | Lawyers Title Of Nevada | |
| Cordova Angelica | -- | None Available | |
| Valdez Hector | $99,000 | Stewart Title Of Nevada | |
| Valdez Hector | -- | Stewart Title Of Nevada | |
| Federal National Mortgage Association | $202,537 | Accommodation | |
| Ormord Joseph W | -- | Chicago Title | |
| Nguyen Mary Dung | -- | First American Title Co | |
| Nguyen Mary Dung | $162,490 | First American Title Co |
Source: Public Records
Mortgage History
| Date | Status | Borrower | Loan Amount |
|---|---|---|---|
| Open | Arreola Sosa Ignacio Manuel | $191,468 | |
| Previous Owner | Cordova Angelica | $123,900 | |
| Previous Owner | Valdez Hector | $96,490 | |
| Previous Owner | Ormord Joseph W | $193,600 | |
| Previous Owner | Nguyen Mary Dung | $146,200 |
Source: Public Records
Tax History Compared to Growth
Tax History
| Year | Tax Paid | Tax Assessment Tax Assessment Total Assessment is a certain percentage of the fair market value that is determined by local assessors to be the total taxable value of land and additions on the property. | Land | Improvement |
|---|---|---|---|---|
| 2025 | $1,172 | $98,187 | $26,950 | $71,237 |
| 2024 | $1,105 | $98,187 | $26,950 | $71,237 |
| 2023 | $1,105 | $92,678 | $25,550 | $67,128 |
| 2022 | $1,176 | $82,370 | $21,000 | $61,370 |
| 2021 | $1,089 | $77,924 | $19,600 | $58,324 |
| 2020 | $1,009 | $76,414 | $18,550 | $57,864 |
| 2019 | $945 | $71,839 | $15,050 | $56,789 |
| 2018 | $902 | $59,006 | $11,900 | $47,106 |
| 2017 | $1,607 | $54,801 | $10,500 | $44,301 |
| 2016 | $846 | $46,101 | $5,600 | $40,501 |
| 2015 | $843 | $37,276 | $3,850 | $33,426 |
| 2014 | $818 | $27,063 | $3,850 | $23,213 |
Source: Public Records
Map
Nearby Homes
- 6209 Gambetta St
- 4215 Macadamia Dr
- 4202 Mango Tree Ct
- 4102 Wendy Ln
- 4024 Edwin Place
- 3829 Northern Light Dr
- 3954 N Walnut Rd
- 3711 Southern Light Dr
- 4064 Rocky Beach Dr
- 3883 Lancome St
- 4211 Dobson Dr
- 4199 Dobson Dr
- 3747 Gulliver St
- 3796 Steinbeck Dr
- 4219 Studio St
- 4329 Studio St
- 4027 Boratko St
- 4311 Faberge Ave
- 4349 Faberge Ave
- 3895 Tatiana St
- 4227 Walnut Family Ct
- 4239 Walnut Family Ct
- 4221 Walnut Family Ct
- 4253 Walnut Family Ct Unit 1
- 4253 Walnut Family Ct Unit as
- 4262 Nutcracker Ct
- 4256 Nutcracker Ct
- 4256 Nutcracker Ct
- 4256 Nutcracker Ct
- 4215 Walnut Family Ct Unit 1
- 4215 Walnut Family Ct Unit n/a
- 4250 Nutcracker Ct
- 4268 Nutcracker Ct Unit 1
- 4275 Walnut Family Ct
- 4234 Walnut Family Ct
- 4244 Nutcracker Ct
- 4240 Walnut Family Ct
- 4228 Walnut Family Ct
- 4222 Walnut Family Ct Unit 1
- 4246 Walnut Family Ct